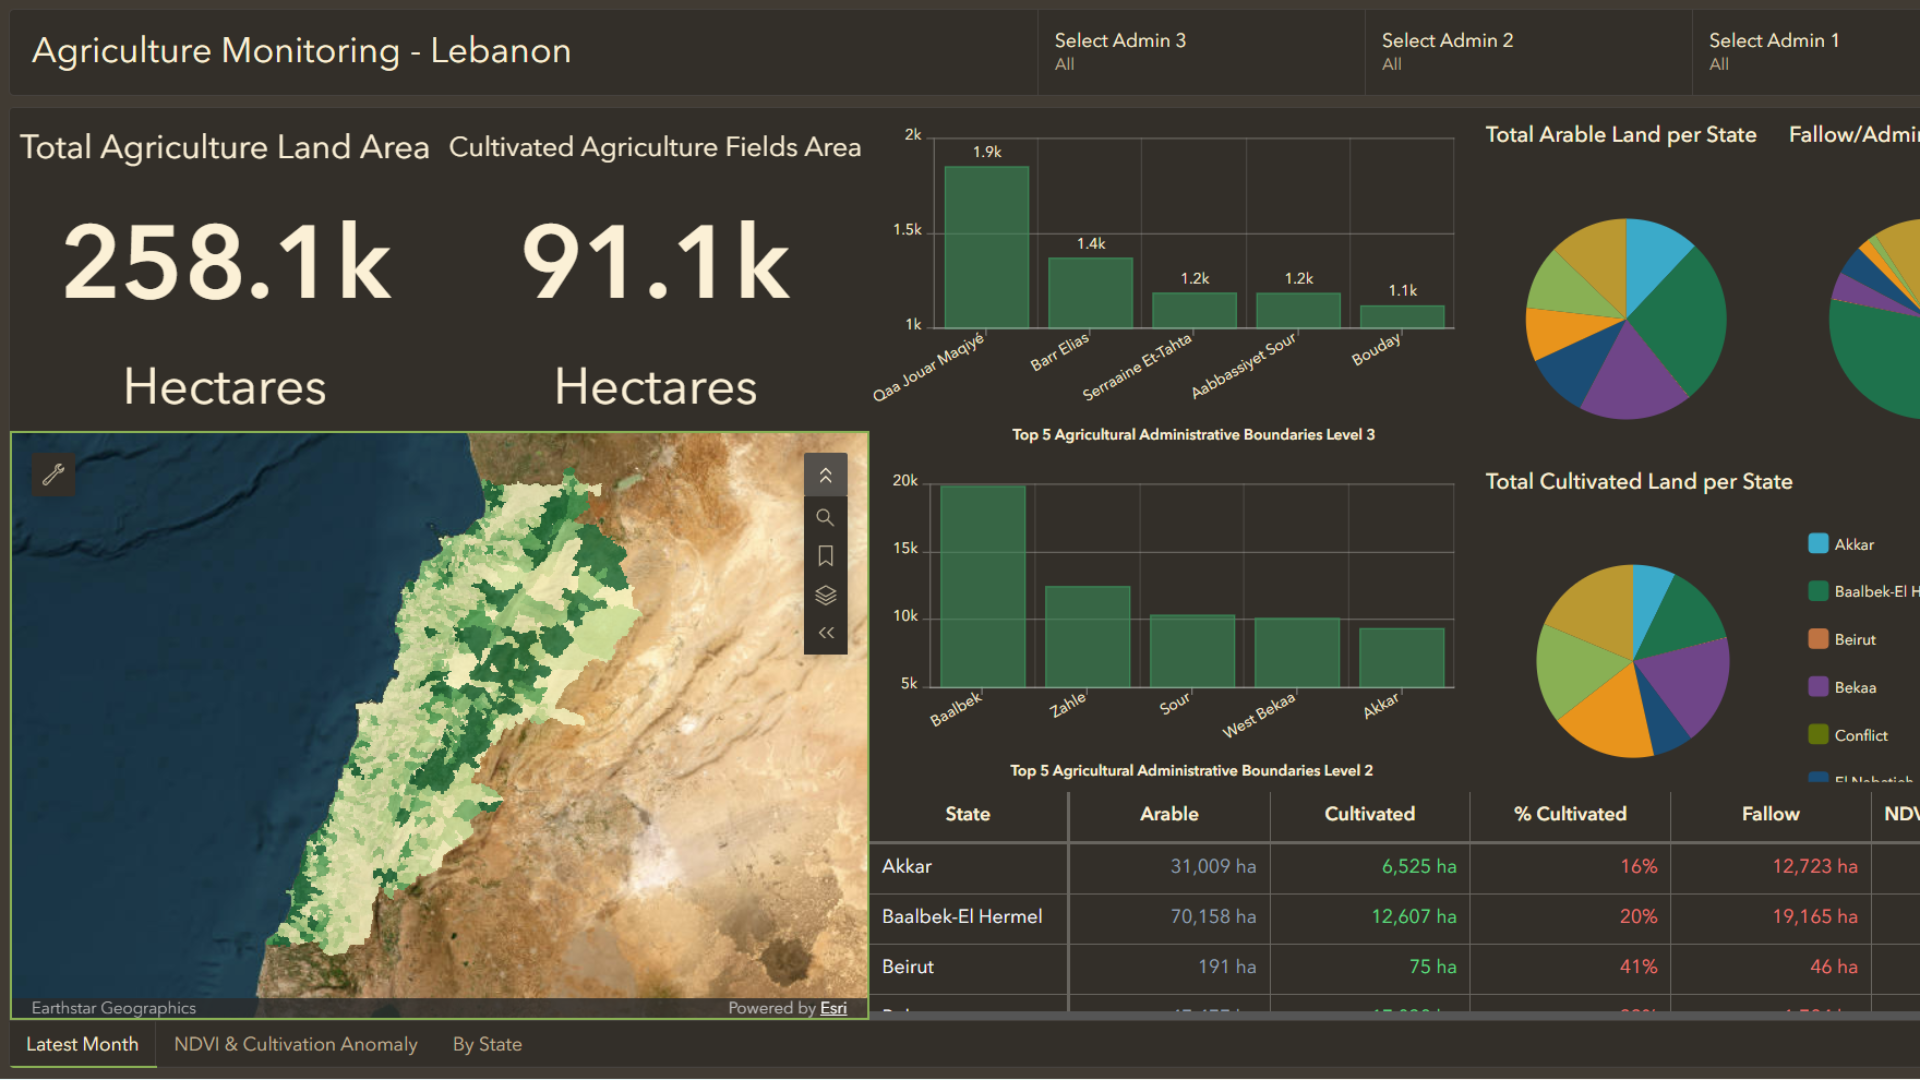
Understanding agricultural productivity at a national scale has traditionally required expensive surveys, or fragmented reporting, making it difficult to capture finer patterns. Conditions can shift month to month due to weather, conflict, disease, or market changes. Tracking these changes is crucial for agricultural censuses, funding decisions, and long-term planning.
The challenge is not just measuring agriculture, but doing so continuously, consistently, and at scale.
Satellite imagery can help fill this gap. With repeat satellite imagery observations from space, we can create a dynamic system of agriculture productivity reporting that captures trends over time, at the national, subnational, and field levels. Below we’ll walk through an example built to monitor agriculture in Lebanon.
The Workflow
This workflow was initialized and automated using a python notebook and tools from the ArcPy library. Visuals below will include content from both the ArcGIS Pro interface and the python notebook.
A note on terminology. Throughout this blog we will refer to land as agricultural, cultivated, and fallow. Agricultural land refers to the entire agricultural field boundary. Cultivated land is the subset of fields with vegetation activity (above 0.5 NDVI value). Fallow land is the agricultural land that falls below the ‘cultivated’ threshold.
1. Data Acquisition
The first step in any workflow is finding the right data. For this process, we used Sentinel-2 Level 2A imagery since it contains the bands needed to calculate NDVI, and is regularly captured.
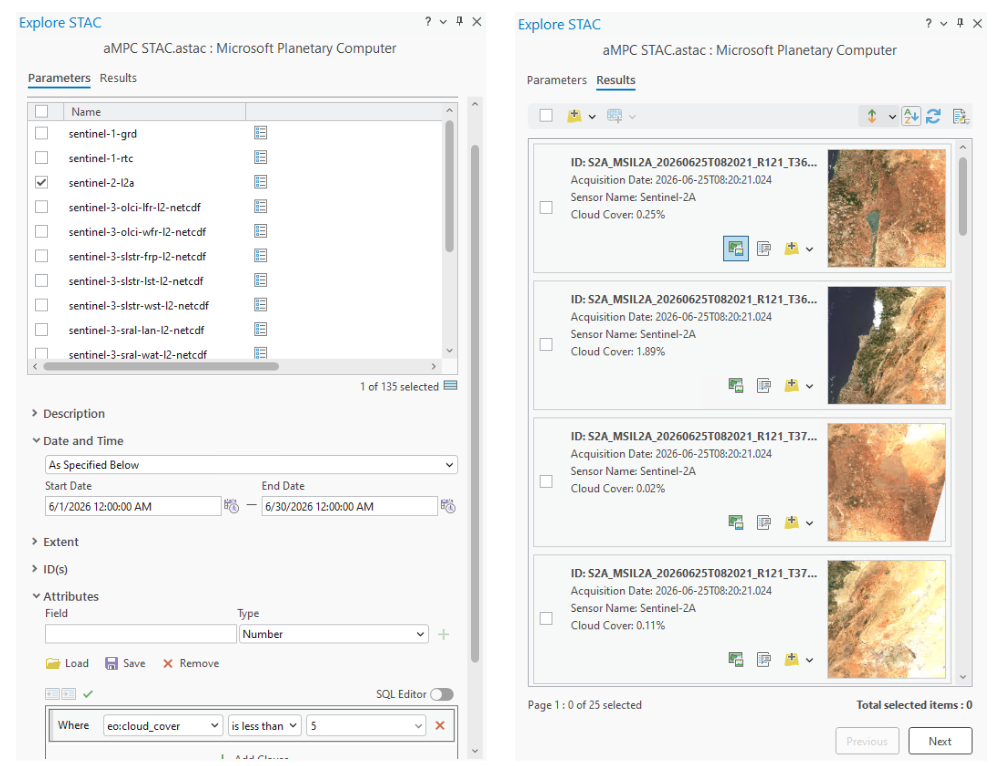
The imagery was accessed directly from the cloud using the Microsoft Planetary Computer STAC API. With the STAC connection, we avoid having to download any imagery. Instead, we use the data where it lives in the searchable catalog of datasets that make up the STAC.
When looking for imagery in the STAC, we can and did filter by date, extent, and cloud cover to find images in the right place, at the right time, with minimal clouds. Individual images for a given time period were then added to a mosaic dataset for analysis.
The image below shows the STAC interface in ArcGIS Pro, however for automation purposes the API can be accessed and searched using python as well.
1.5: Field Boundary Detection
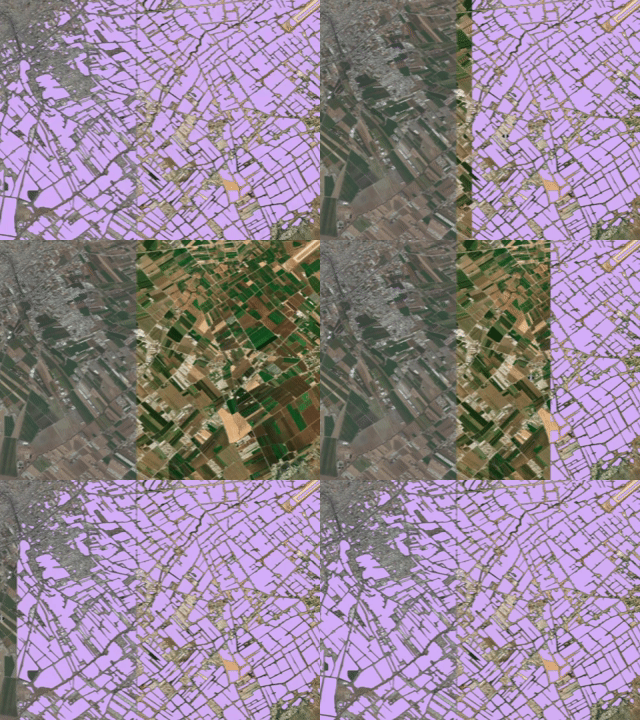
These field boundaries are prepared as an input layer – extracted from imagery once – using deep learning. For this workflow, we used the agricultural field delineation model from the ArcGIS Living Atlas to create polygon field boundaries. You can also fine-tune this model, or train your own model to improve accuracy.
2. Image Analysis
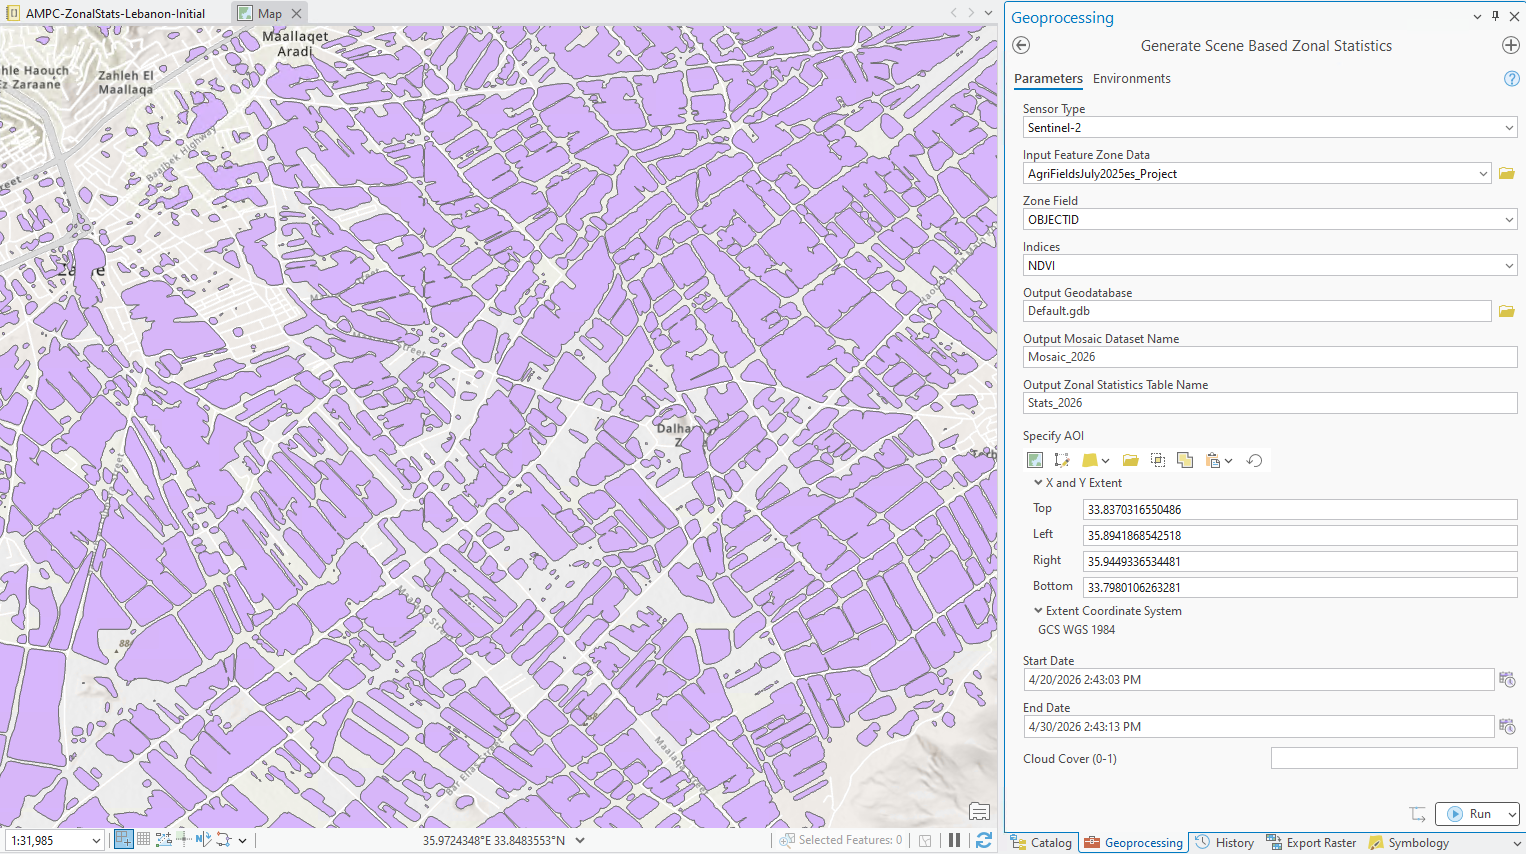
This monitoring solution is based on NDVI values. NDVI (Normalized Difference Vegetation Index) is a measure of vegetation greenness, where higher values indicate healthier vegetation, which makes it a useful proxy for crop activity. NDVI values were calculated for every pixel in the imagery. Again, this is performed programmatically through the python notebook, but could also be done using the NDVI raster function or the raster calculator in ArcGIS Pro.
Then, NDVI values are summarized to the agricultural field boundaries using Zonal Statistics, creating field level statistics (average NDVI, minimum, maximum, variability, etc.), giving each field a measure of greenness/growth. Monthly, this process reruns using the zonal statistics tool in ArcPy.
The mean NDVI value for each field is used to classify the field as cultivated or fallow. A field is considered cultivated if the NDVI is greater than 0.5, fallow if it is below.
3. Aggregate
While field-level insights are highly detailed, government officials and other decision-makers often need information summarized at larger geographic levels.
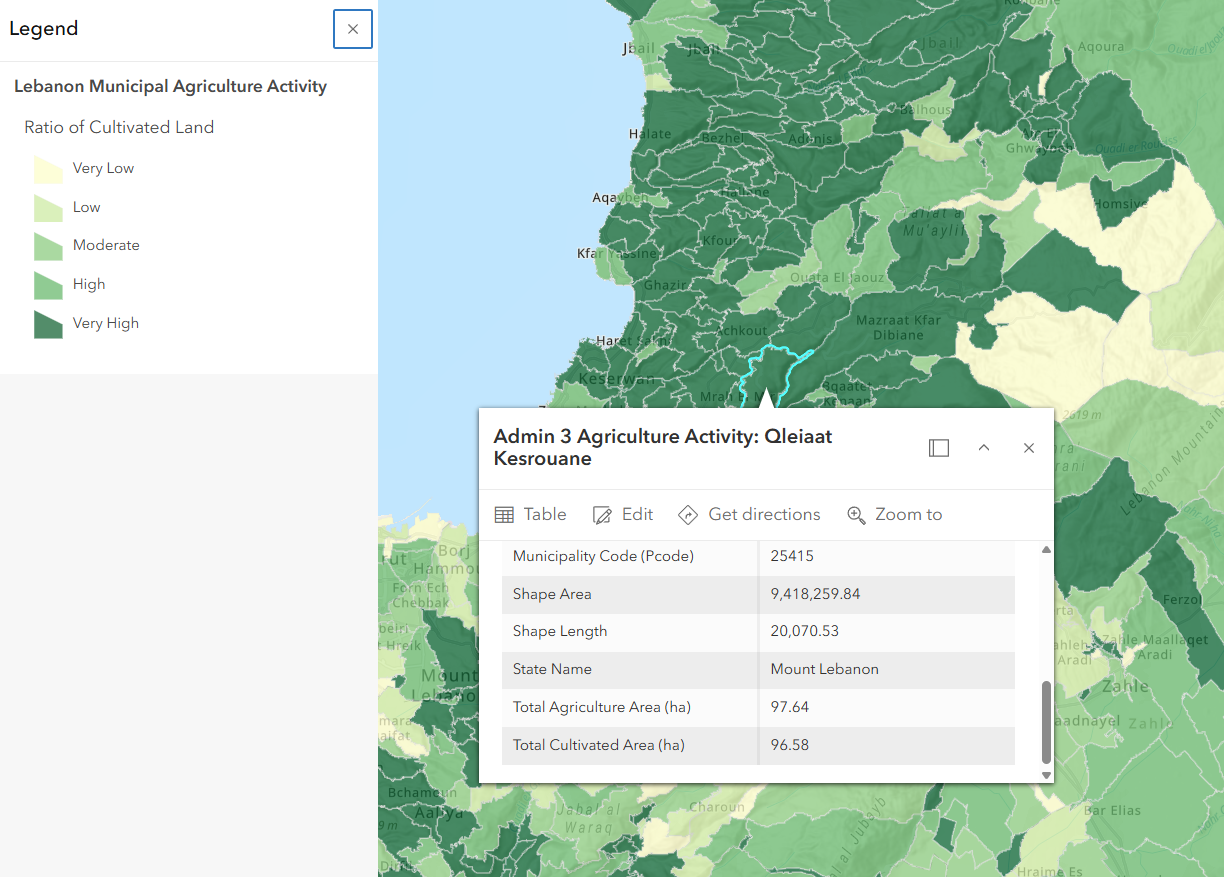
The field-based NDVI statistics are aggregated to administrative boundaries from the ArcGIS Living Atlas, creating monthly indicators for Admin 3, Admin 2, and Admin 1 boundaries. Additionally, the hectares of each field type (cultivated, fallow, agricultural) are summarized to each administrative level.
These summaries are used to monitor agricultural conditions across the country overtime.
4. Store, manage, and repeat
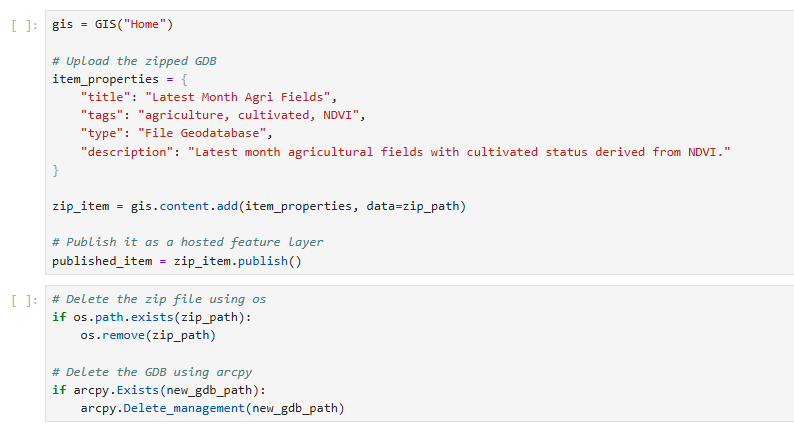
Ultimately, we have multiple layers – one per administrative level and one for fields. Each with monthly NDVI values, derived agricultural classifications, and summary statistics. These feature layers are then published to ArcGIS Online for sharing. In addition to creating feature layers, we can generate PDF reports automatically for easy sharing with stakeholders.
All of this is automated using python to run monthly, meaning the data is always up to date, historical records are preserved, and monitoring is continuous. Data is never deleted or overwritten, rather the next month’s data is added to the existing dataset, creating a large time-series database that can be analyzed. Upon completion of a month’s analysis, the script automatically detects the next processing period using existing data in the tables.
5. Visualize and Deliver
With all the data in ArcGIS Online, web maps and apps were created and shared through this hub site. I’d recommend exploring the site yourself, and I’ll highlight two of my favorite pieces below.
First, is the monitoring dashboard. This dashboard brings all of our data together in one easy to digest web app. There are three different views focusing on the latest month, NDVI and cultivation anomaly, and state by state variability respectively. And all three of these pages update monthly when the script reruns. In other words, the data is never out of date.
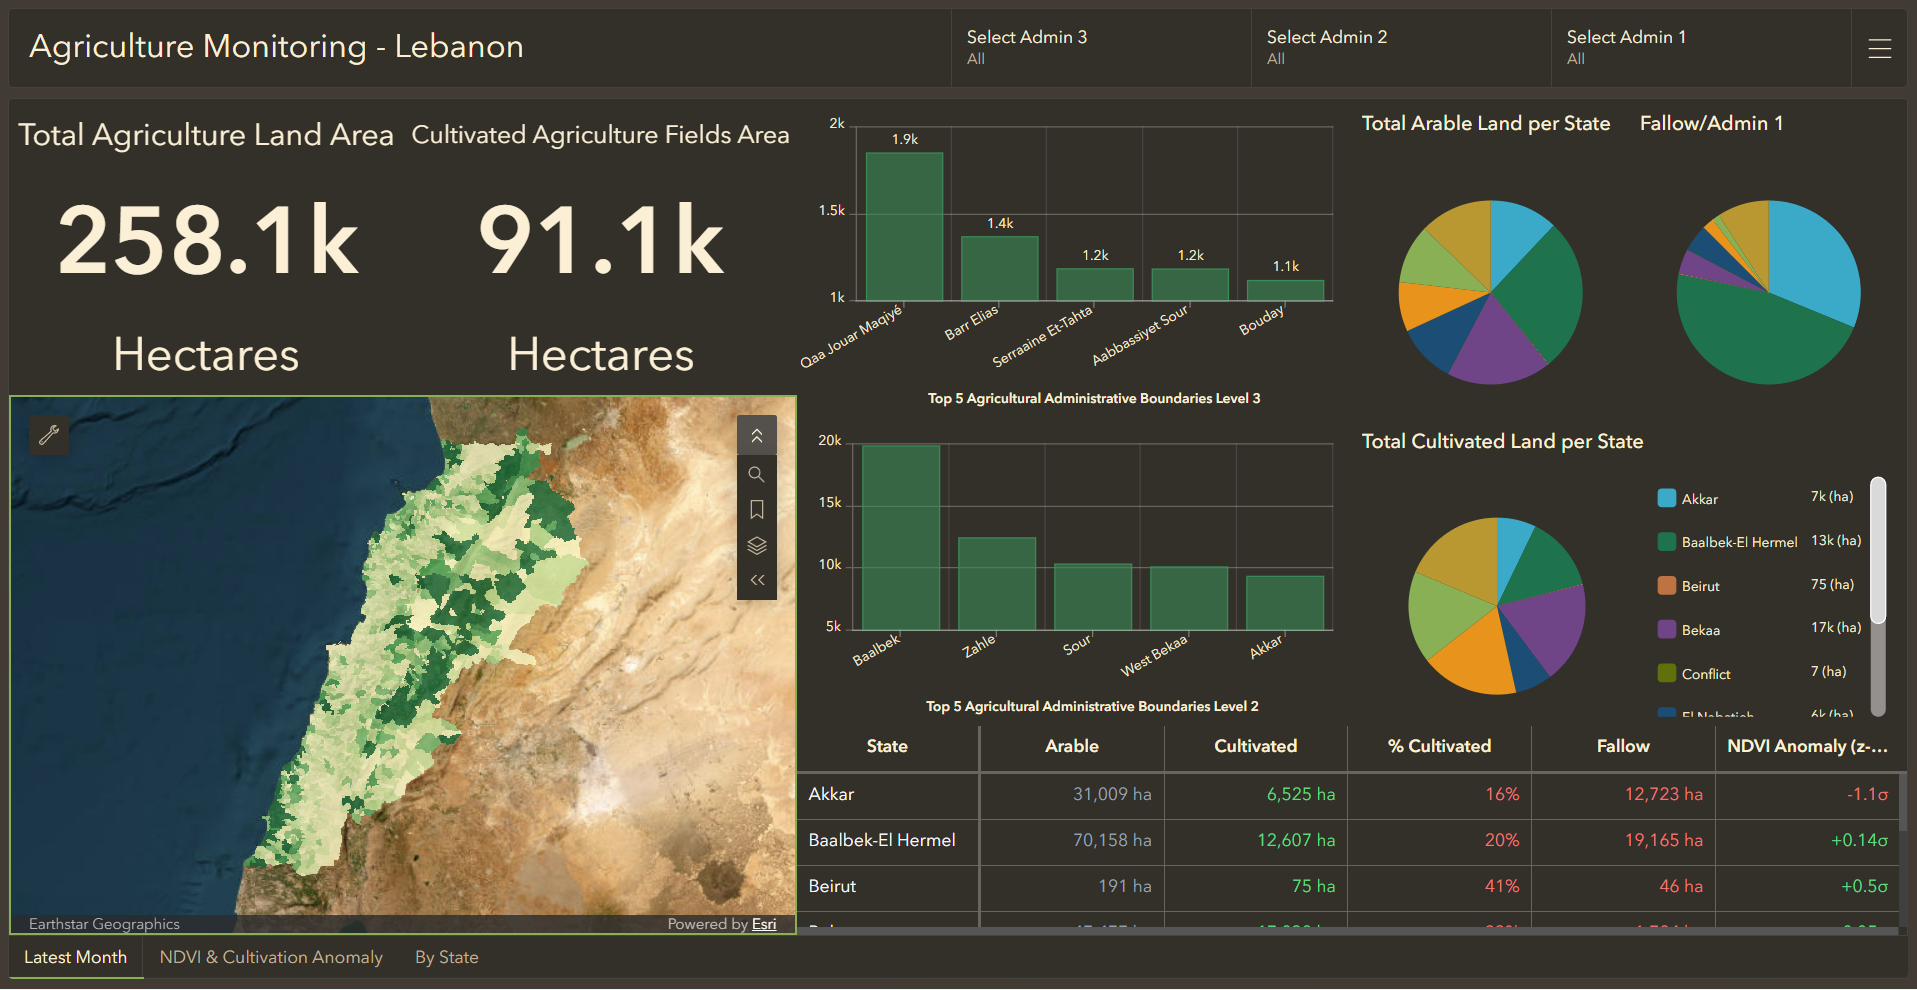
Not only is the dashboard interactive and filterable, but the map is as well. Custom pop-ups for the aggregated administrative data were created with the ArcGIS Arcade assistant, and the agricultural fields appear when you zoom in.
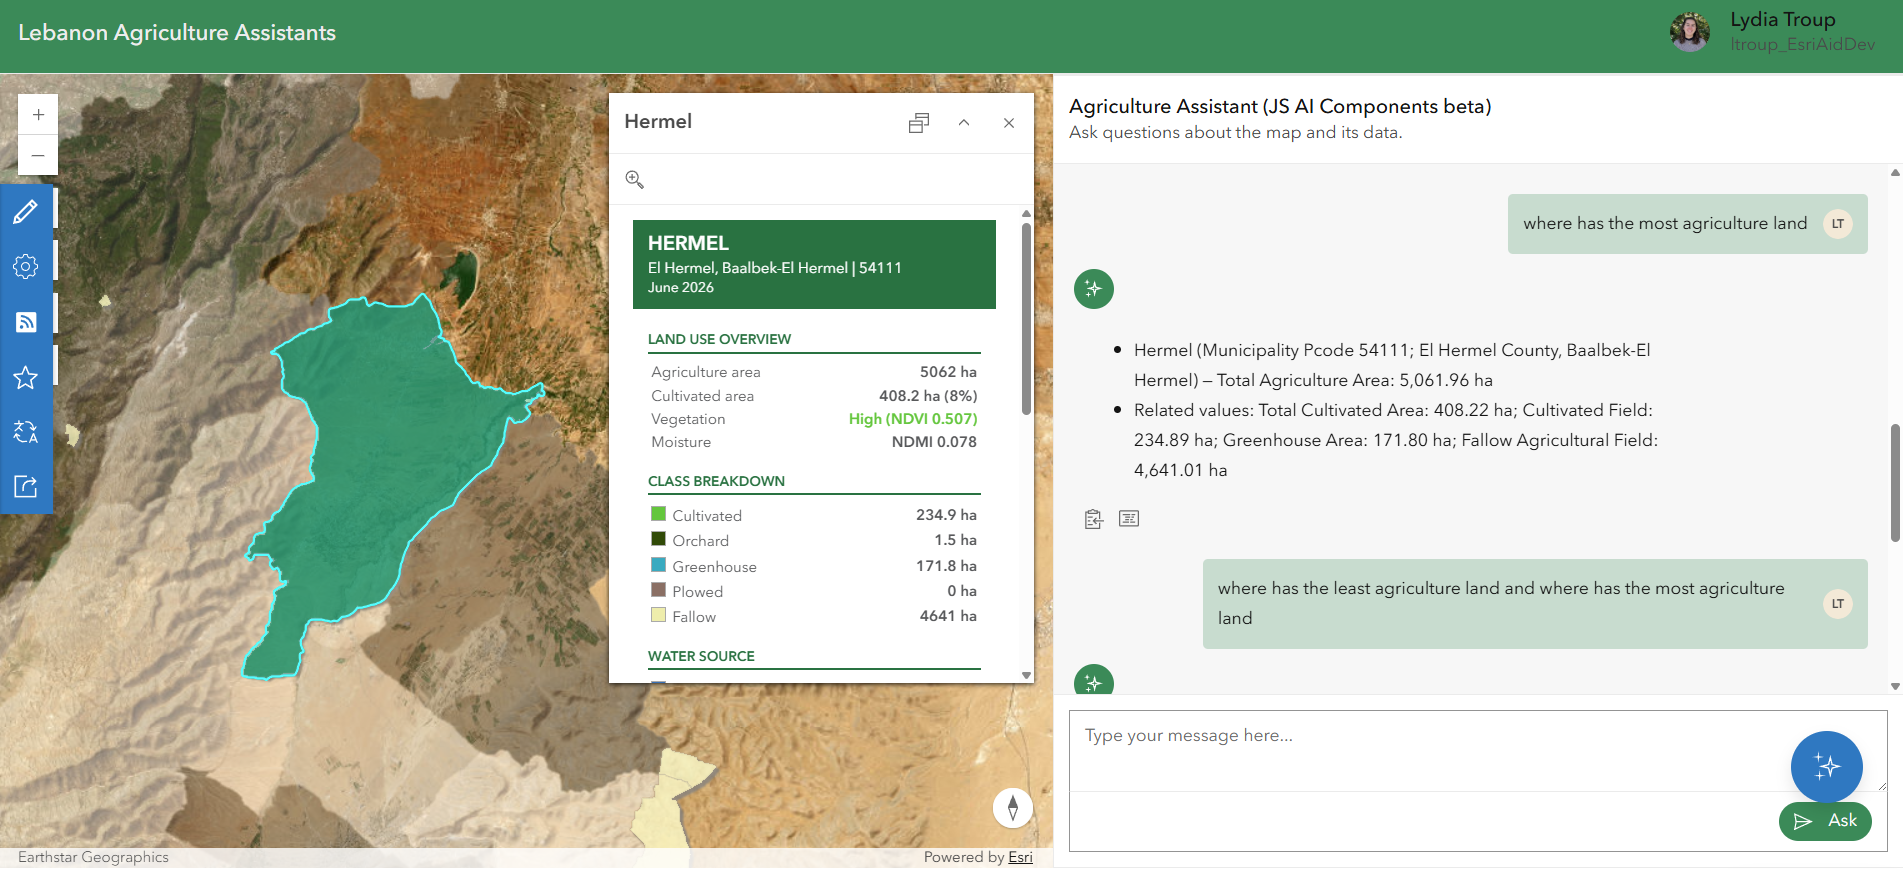
Second, is the agriculture agent app that leverages the new AI-components and the ArcGIS Maps SDK for JavaScript. The AI components enable developers to build agentic web mapping applications. In this application, users can interact directly with the web map using natural language to learn more about the state of agriculture in Lebanon. Click on the photo below to test it out yourself! As the AI-components are still in beta, an ArcGIS Online log-in is required to access the app and the username field is case-sensitive.
Agricultural statistics are often produced periodically, leaving large gaps in time. Here, satellite imagery is processed each month to update field-level and administrative indicators, creating a continuously growing time series of agricultural conditions. Historical records are preserved, new observations are added automatically, and users can monitor how agricultural activity changes over time rather than relying on a single snapshot. The result is a practical, repeatable monitoring system that supports everything from routine reporting to the early identification of emerging changes and potential shocks.



Article Discussion: