In this blog, read about how you can use the new Change Detection Wizard in ArcGIS Pro 2.7 to evaluate land cover and vegetation changes in Ethiopia. When you’re done, take a look to see how your corner of the world is changing.
Land cover change in Ethiopia
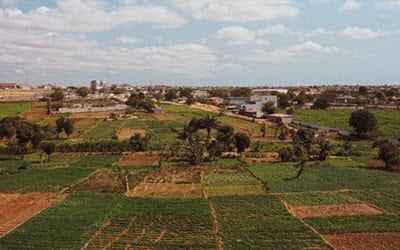
In the last 40 years, the population of Ethiopia has grown from ~40 million to ~110 million people. This population growth, along with changes in land management practices and agriculture, has results in some significant changes to the landscapes of this sub-Saharan African country.
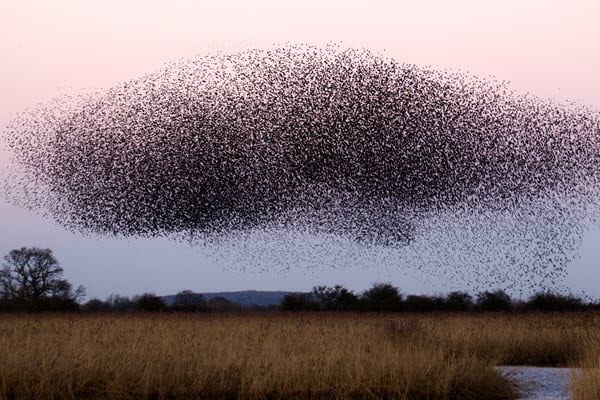
In addition to these longer-term changes in land use and land cover, the 2020 locust swarm (considered the worst locust outbreak in 25 years) has seriously impacted the agriculture, economy, and livelihoods of millions of Ethiopian citizens.

Change Detection Wizard
With the new Change Detection Wizard in ArcGIS Pro 2.7, you can evaluate land cover change, vegetation coverage change, and other types of change using imagery and raster datasets:
- Categorical change—Identify the type of change that has occurred between two thematic or categorical rasters, such as land cover. You can save your final output as a raster dataset, a polygon feature class, or a raster function template.
- Pixel value change—Calculate the difference in pixel values between two continuous rasters, such as temperature rasters or multiband imagery. You can save your final output as a raster dataset, a polygon feature class, or a raster function template.
- Time series change—Identify the date of change in a time series of images using either the Continuous Change Detection and Classification (CCDC) method or the Landsat-based Detection of Trends in Disturbance and Recovery (LandTrendr) method. You can extract the date of earliest, latest, or largest change, or the total number of changes on a pixel-by-pixel basis.
The wizard is included with the ArcGIS Image Analyst extension.
In a new Learn Lesson, we calculated the long-term changes in Ethiopian land cover using two land cover datasets, then we evaluated the change in vegetation index values by comparing two Landsat scenes, before and after/during the locust swarm in 2020.

Check out the new Learn Lesson here or by clicking the image above!
When you’re finished, be sure to do some change detection for your country, city or neighborhood!

Article Discussion: