Imagery is no longer just a backdrop in GIS workflows. In ArcGIS Pro, it’s a first-class data type – with powerful tools and workflows tailored for a wide range of imagery professionals, from GIS analysts, image analysts, to remote sensing professionals to perform image science. Whether you’re correcting raw satellite data, working with drone video, or analyzing long time series of environmental data, ArcGIS Pro has built-in capabilities ready to support your needs.
This post outlines the core and advanced imagery capabilities in ArcGIS Pro – what’s already there, and how it’s being used.
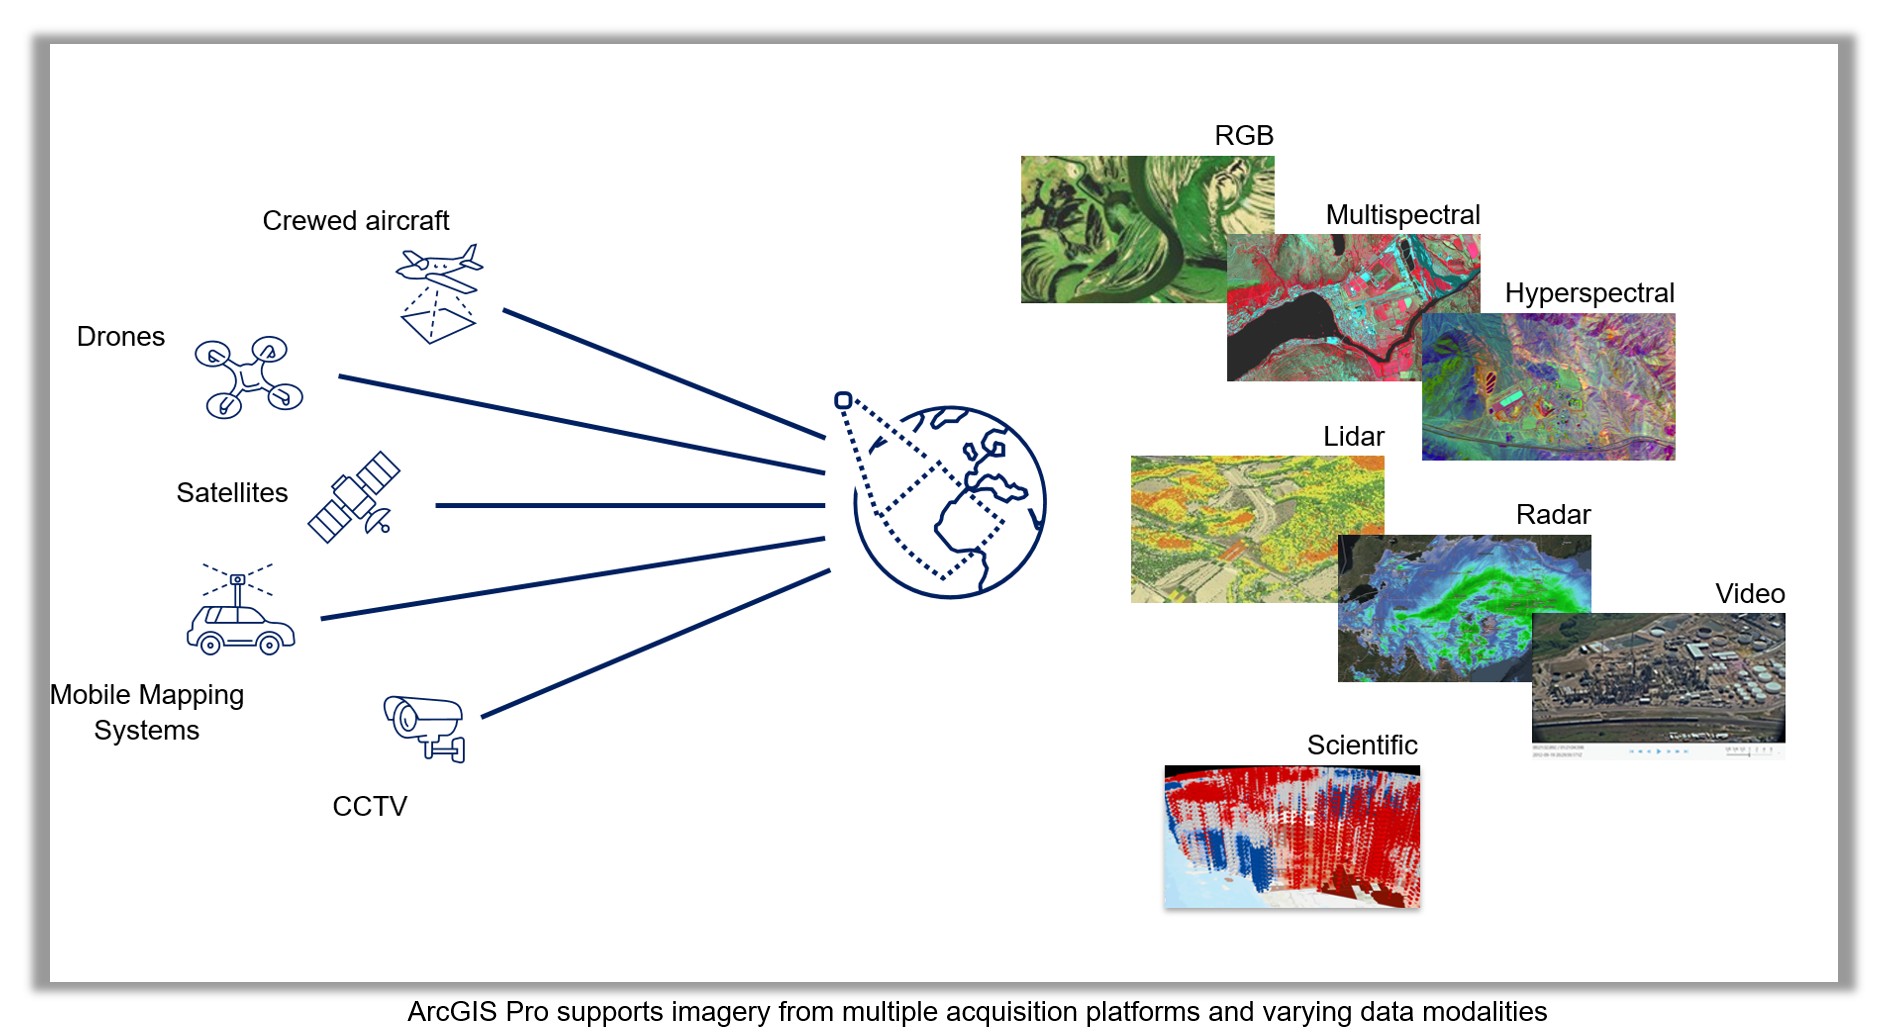
Support for Diverse Imagery Modalities
ArcGIS Pro supports imagery from over 70 raster formats and more than 50 sensors, including platforms like Landsat, Sentinel, Airbus, Maxar, and many others. These diverse data types—ranging from high-resolution satellite scenes to drone, aerial, 3D, stereo, hyperspectral, oriented, and video imagery—can be visualized and processed in seconds thanks to raster products.
Raster products are smart data models that leverage on-the-fly raster function chains behind the scenes. They dynamically apply sensor-specific corrections (e.g., radiometric calibration, orthorectification, projection) without modifying the raw source, allowing immediate analysis with no preprocessing delay.
Tailored Viewers and Analysis Experiences for Every Data Type
ArcGIS Pro offers uniquely optimized viewing and analysis environments depending on the modality of imagery being used:
Stereo imagery: Use stereo map viewers for precise 3D feature collection, inspection, and measurement.
3D and voxel data: Visualize and analyze scientific or topographic datasets in true 3D space using voxel cubes and 3D scenes.
Oriented imagery: Navigate ground-level or oblique imagery (e.g., from street cameras or UAVs) in the Oriented Imagery viewer, linked to the map for spatial awareness.
Full Motion Video: Step through and analyze video frame-by-frame while extracting georeferenced features, using the FMV-enabled player.
Multidimensional data: Analyze atmospheric or oceanographic phenomena using slices and profiles over time or depth using the Multidimensional tab
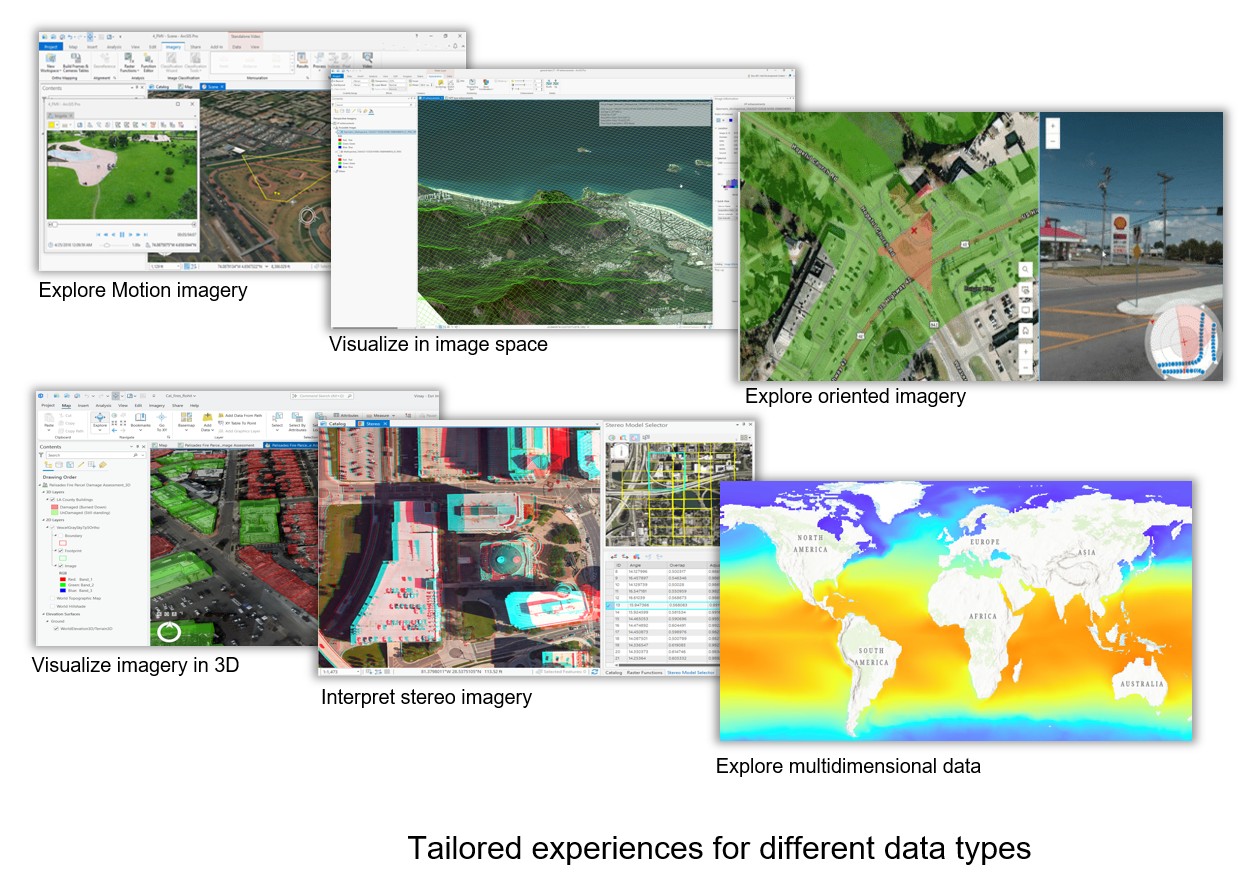
These tailored viewers are exposed through contextual tabs, ribbon groups, wizards, and add-ins, dynamically adapting to the type of imagery selected – ensuring users always have the right tools at the right time.
Exploration and Exploitation Tools for Pixel-Level Analysis
ArcGIS Pro provides a rich set of tools that allow analysts to move beyond visual interpretation and directly interrogate imagery at the pixel level – unlocking deeper insights for time, spectral, and change analysis. Key capabilities include:
- Spectral Profile Charts – Visualize the spectral signature across all bands for a specific pixel or area, aiding in material identification and classification.
- Image Scatter Plots – Examine the relationship between any two spectral bands to identify patterns, clusters, or anomalies.
- Temporal Profile Charts – Plot time-series data for a pixel or area to reveal trends, seasonal patterns, or gradual change.
- Pixel Time Series Change Explorer – Interactively detect and visualize changes or disturbances over time for any location in your imagery.

These tools are critical in defense and intelligence, disaster response, agriculture, and other domains where analysts need to extract actionable information directly from pixels—transforming raw imagery into meaningful intelligence.
Analysis Using Raster Functions.
In ArcGIS, raster functions are quick, on-the-fly processes you apply to imagery or raster data without permanently changing the original file. They run in memory, so you see results right away, and you can chain multiple functions together to create a series of steps, such as calculating NDVI, adjusting colors, and clipping to an area. Because they don’t create a new file unless you choose to save the result, raster functions make it easy to experiment, analyze, and visualize imagery quickly without using extra storage or processing time.
Out of the box, ArcGIS Pro includes more than 160 raster functions for performing common image analysis tasks. These include:
- Radiometric adjustments such as stretch, contrast, convolution, and pansharpening
- Spectral indices such as NDVI, NDWI, NDBI, and user-defined band arithmetic
- Terrain analysis functions such as slope, aspect, and hillshade
- Raster math and algebra for pixel-level calculations
Multiple functions can be chained to accomplish complex tasks. Raster functions are ideal for quick inspection or prototyping of image analysis before committing to more intensive batch processing with geoprocessing tools.

Going Deeper with the Image Analyst Extension
The Image Analyst extension transforms ArcGIS Pro into a full-featured image analysis workstation, unlocking advanced capabilities for specialized workflows. It’s designed for professionals who need to go beyond basic visualization, enabling deeper insights and more precise results. Key capabilities include:
- Deep learning workflows – Train models, classify imagery, and detect objects such as building footprints, deforestation areas, or disaster damage, all within ArcGIS Pro.
- Advanced classification and regression – Move beyond traditional pixel-based classification with supervised and unsupervised methods. Use machine learning algorithms like random trees, support vector machines, and k-nearest neighbor for more accurate results.
- Synthetic aperture radar (SAR) processing – Create Radiometric Terrain Corrected (RTC) datasets, detect water bodies, identify dark ocean objects, and compute SAR indices for advanced analysis.
- Hyperspectral analysis – Detect anomalies, unmix spectral signatures, and explore data across hundreds of narrow bands for mineral mapping, vegetation health, and other specialized applications.
- Multidimensional data analysis – Analyze climate, oceanographic, and remote sensing time-series data using slices, profiles, and trends over time or depth.
- Full-motion video (FMV) – View and analyze drone or aerial video with synchronized playback, georeferenced overlays, and the ability to extract features directly from frames.
- Stereo and mensuration tools – Measure and extract 3D features with precision using overlapping stereo imagery.
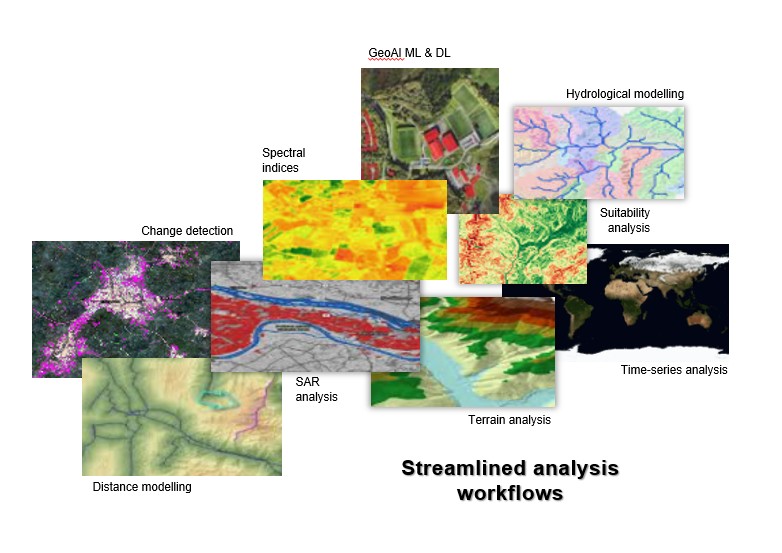
Additionally, the extension provides dozens of advanced raster functions for on-the-fly processing – such as distance modeling, hydrological modeling, and complex terrain analysis – helping you prototype and refine results before running large-scale batch workflows.
All of this is surfaced through intuitive experiences: ribbons, task-based wizards, specialized viewers tailored for imagery users without requiring scripting upfront.
Spatial Analyst Extension for Imagery
The Spatial Analyst extension is well known for its terrain and modeling tools, but it also delivers a rich set of capabilities for working directly with imagery. It’s designed to help GIS analysts move beyond simply viewing imagery as a basemap – turning it into a powerful source for extracting patterns, building models, and integrating with other GIS layers. Key capabilities include:
- Interpolation and surface modeling – Create continuous surfaces from sample points (e.g., elevation, temperature, pollution) to visualize and analyze spatial trends.
- Suitability modeling – Combine imagery with other data layers to identify the most suitable locations for a given purpose, such as land development, conservation, or agriculture.
- Density and distance analysis – Measure the concentration of features (e.g., population, events) or compute distances and cost paths across a landscape.
- Zonal statistics and reclassification – Summarize raster values within defined zones or reclassify pixel values to simplify or highlight areas of interest.
By combining these tools with imagery, Spatial Analyst enables workflows that uncover actionable insights – whether you’re mapping flood risk, identifying wildlife habitat, or modeling accessibility across a region.
Final Thought
ArcGIS Pro delivers far more for imagery than many users realize, going well beyond simple basemaps or static raster viewing. Whether you’re rapidly correcting raw data, exploring spectral and temporal trends, leveraging AI-powered models, or authoring rich multidimensional and 3D content, Pro provides a complete environment for image-centric GIS work. These tools empower analysts, imagery managers, and data scientists alike to extract insight, detect change, and share results seamlessly. If you haven’t explored the Imagery tab and its analysis capabilities, now’s the perfect time to see just how much is already at your fingertips.


Article Discussion: