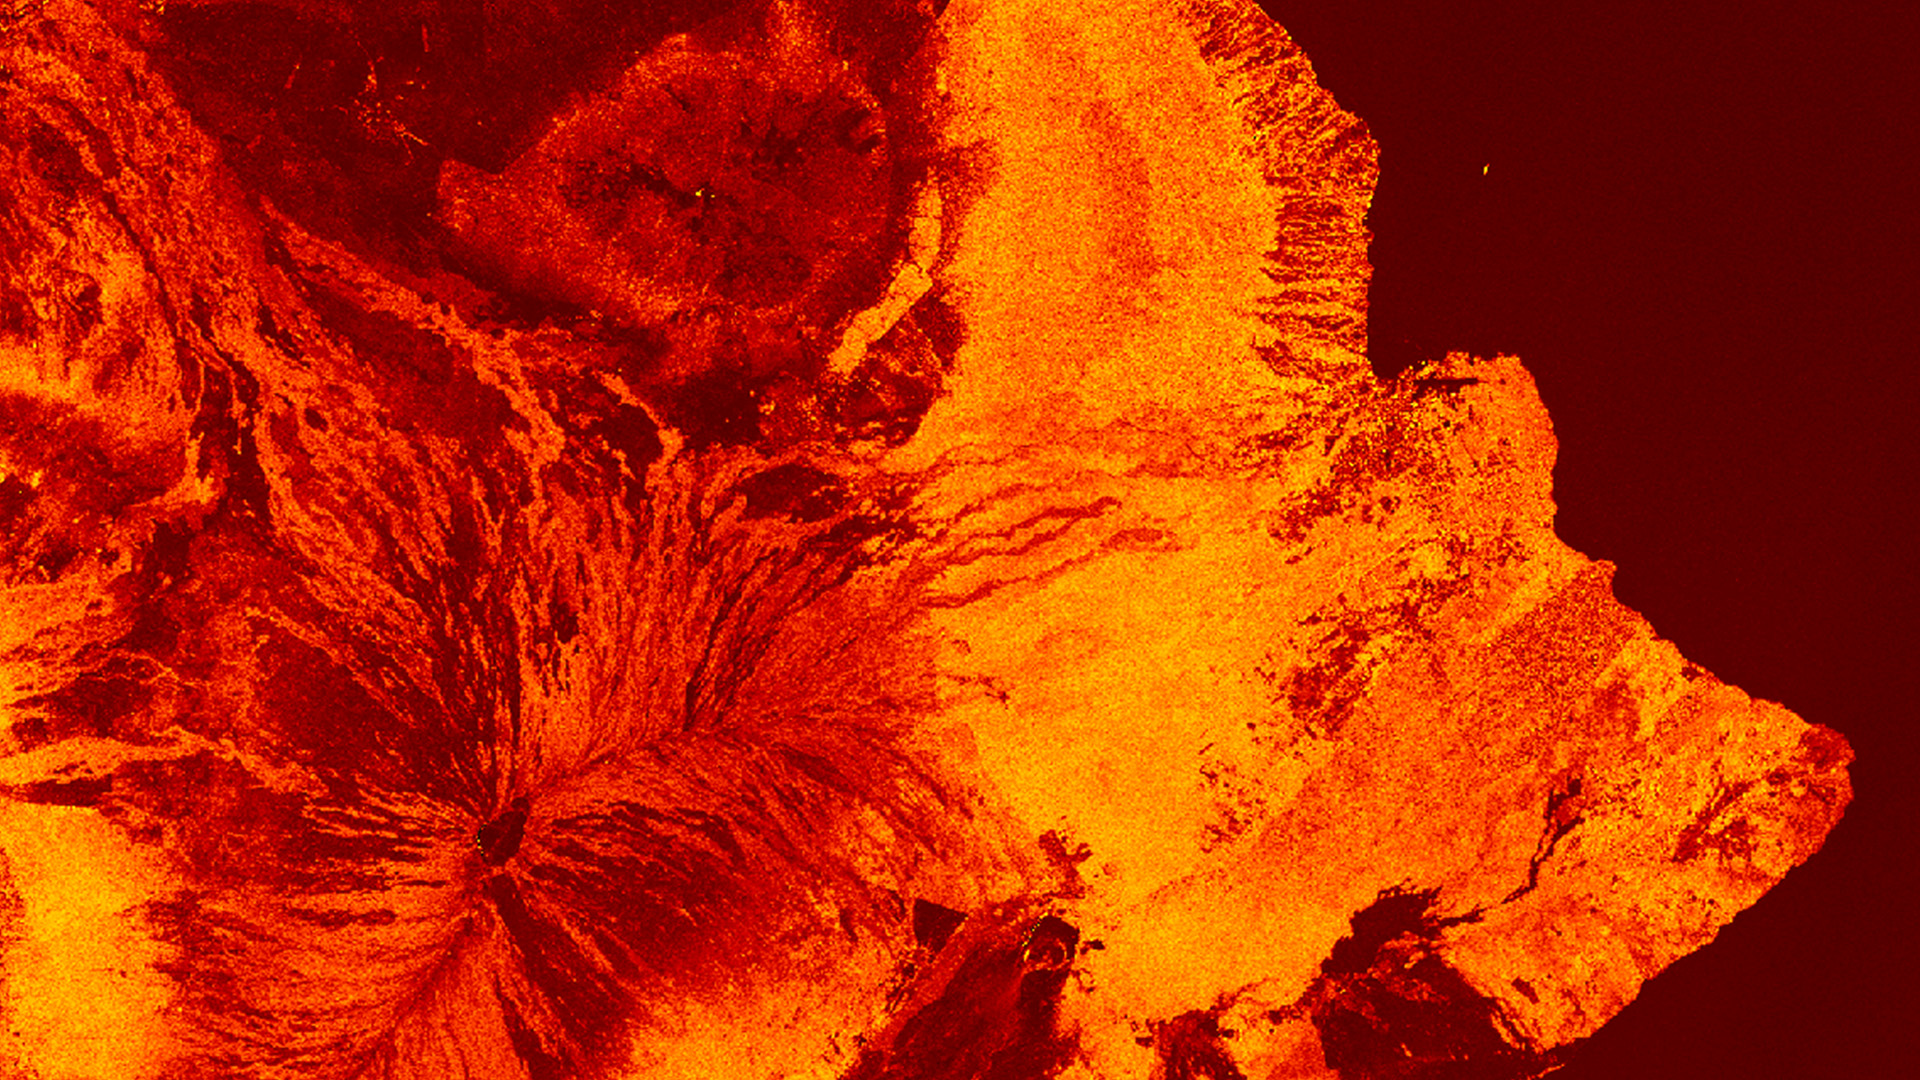
Aloha, remote sensing fans! The NASA/ISRO (Indian Space Research Organisation) Synthetic Aperture Radar (NISAR) satellite is a complete game changer for surficial Earth observations such as land movement, ice changes, vegetation structure, soil moisture, and more. SAR sensors can image the Earth’s surface regardless of cloud cover and light conditions using the microwave range of the electromagnetic spectrum. These wavelengths can range from K-band to P-band. Click here for the basics of SAR bands, frequencies, wavelengths, and applications.
Sentinel-1 SAR provides the first publicly available, global C-band dataset; its measurements capture the top layer of forest canopy. NISAR stands out because it provides the first publicly available global dataset captured with an L-band sensor. The L-band signal has a longer wavelength than C-band, allowing it to penetrate further through vegetation, capturing information from underneath the forest canopy. As such, NISAR provides insight into features that are hidden from view in optical or shorter-wavelength SAR imagery.
Data Acquisition
Have you been waiting for NISAR’s data release? So have we! A selection of pre-calibration NISAR Level-1 to Level-3 L-band products are available to download through the ASF DAAC. Fully calibrated L-band data is expected to be available globally starting in July 2026.
Bring NISAR Data into ArcGIS Pro
ArcGIS Pro has supported working with NISAR HDF5 files as multidimensional raster datasets since version 3.4. The May 2026 ArcGIS Pro 3.7 release provides additional support for Geocoded Polarimetric Covariance (GCOV) products as a raster type. You can now easily load GCOV datasets into ArcGIS Pro following this documentation.

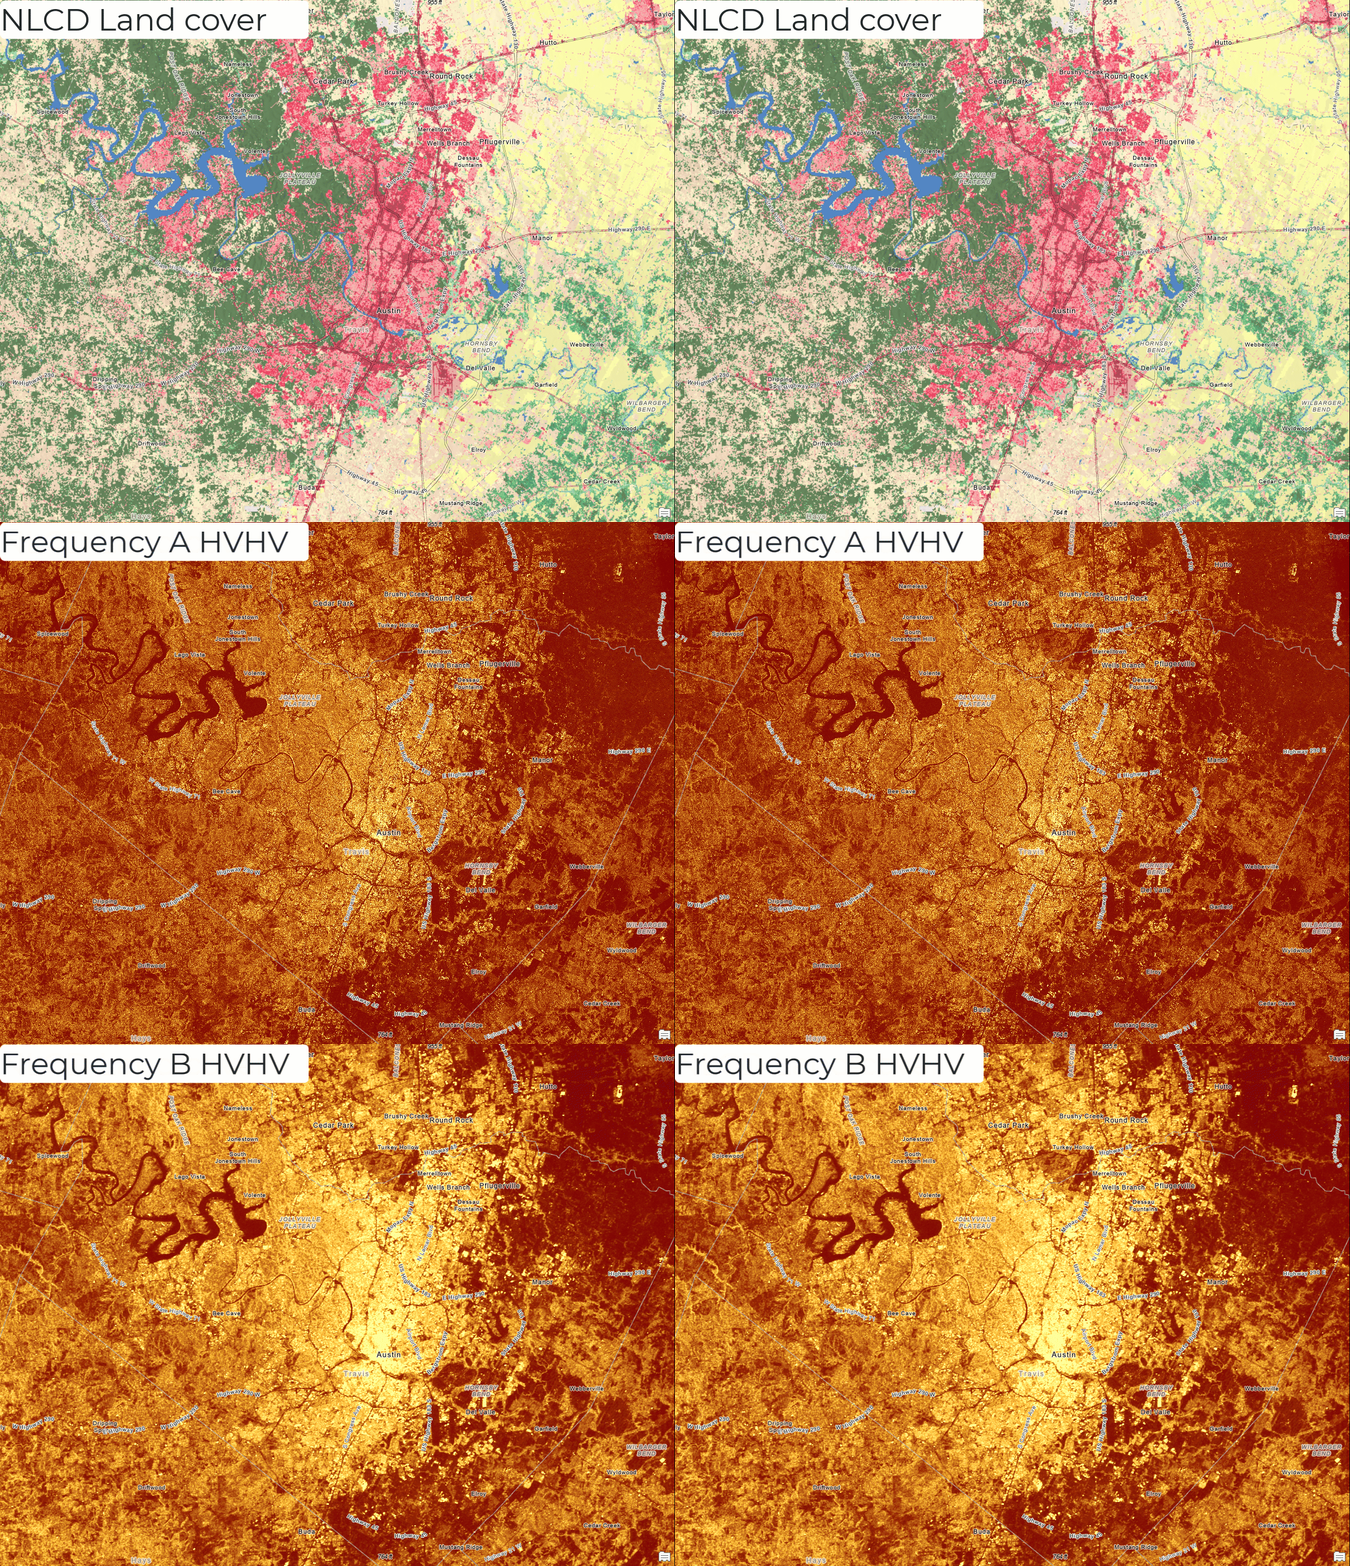
The following processing templates are available for NISAR data: Frequency A and Frequency B for both Radar Backscatter and Cross Covariance. Note: Cross-covariance templates are only included for quad-polarization GCOV products. Not sure what frequency to work with? Frequency A GCOV products provide the most detailed view, at 10- or 20-meter pixels depending on the acquisition mode. Frequency B products are generally less spatial detail at 80 meters, with the benefit of smaller file sizes and faster processing and display.
SAR Data in ArcGIS Pro
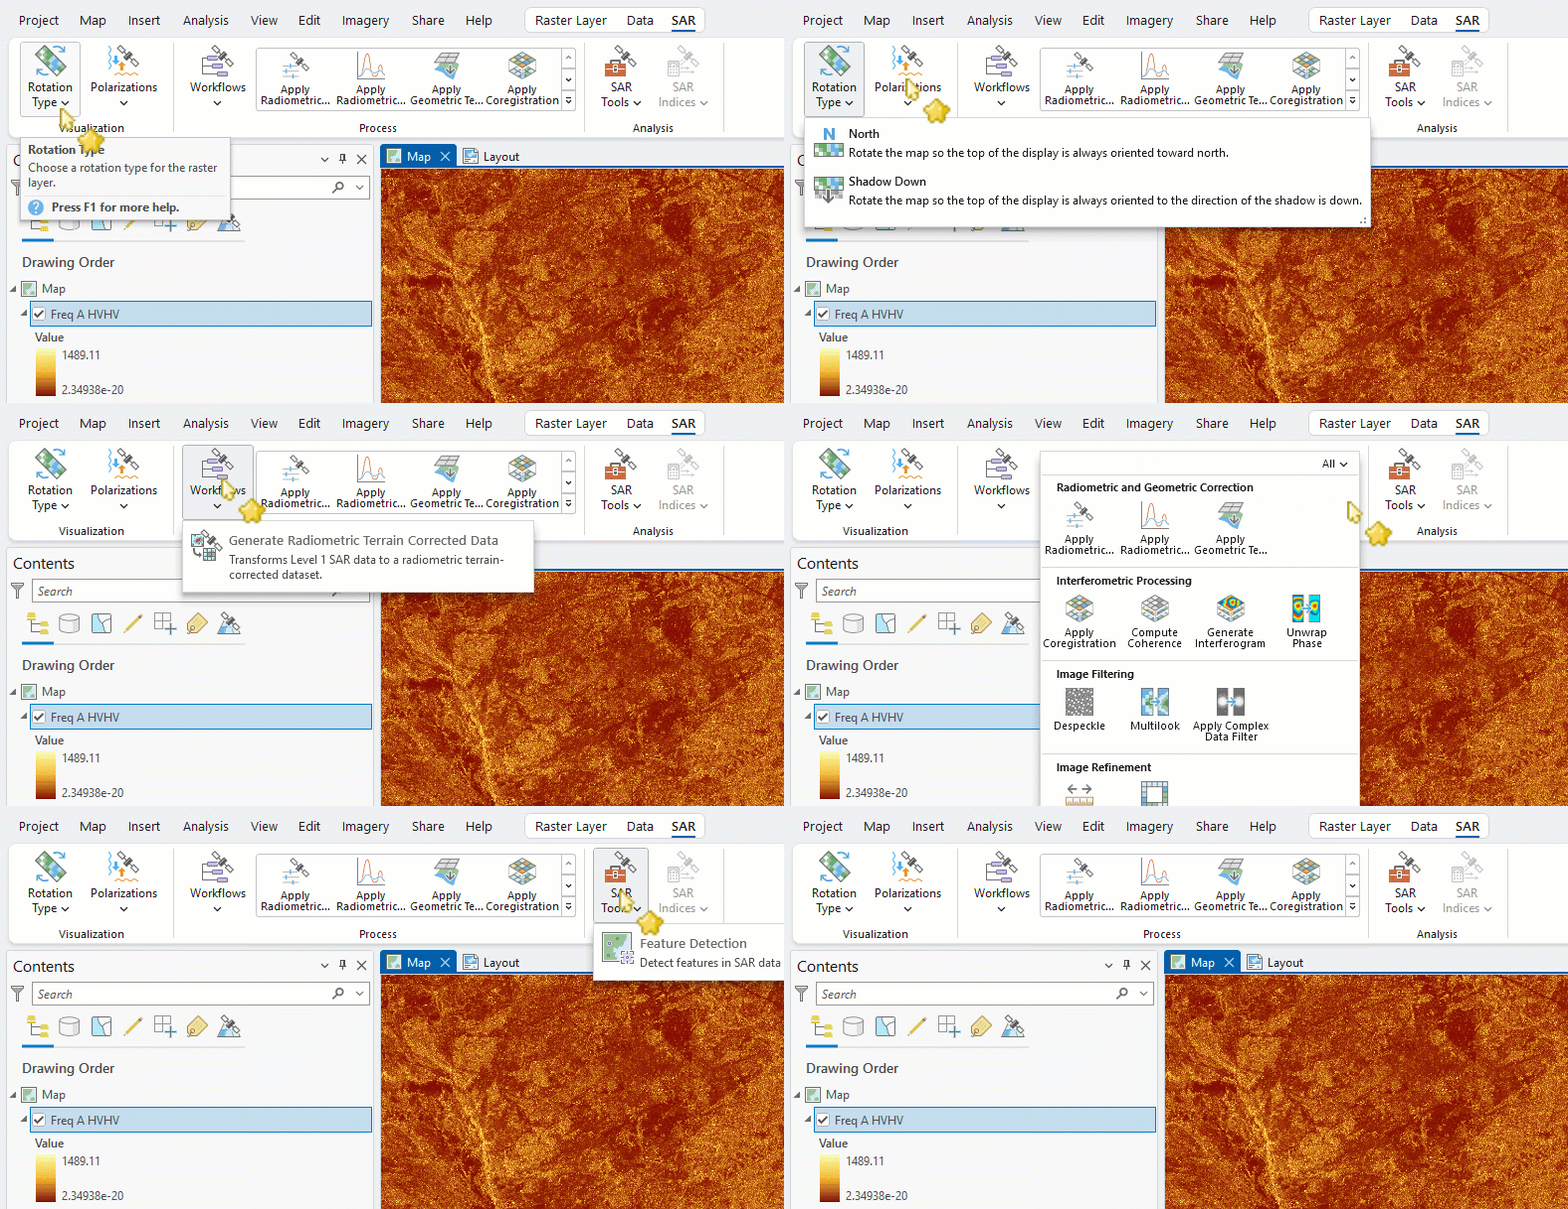
When you select a NISAR dataset in the ArcGIS Pro Contents pane, the SAR tab automatically becomes available to help you visualize, process and analyze the data
Visualization
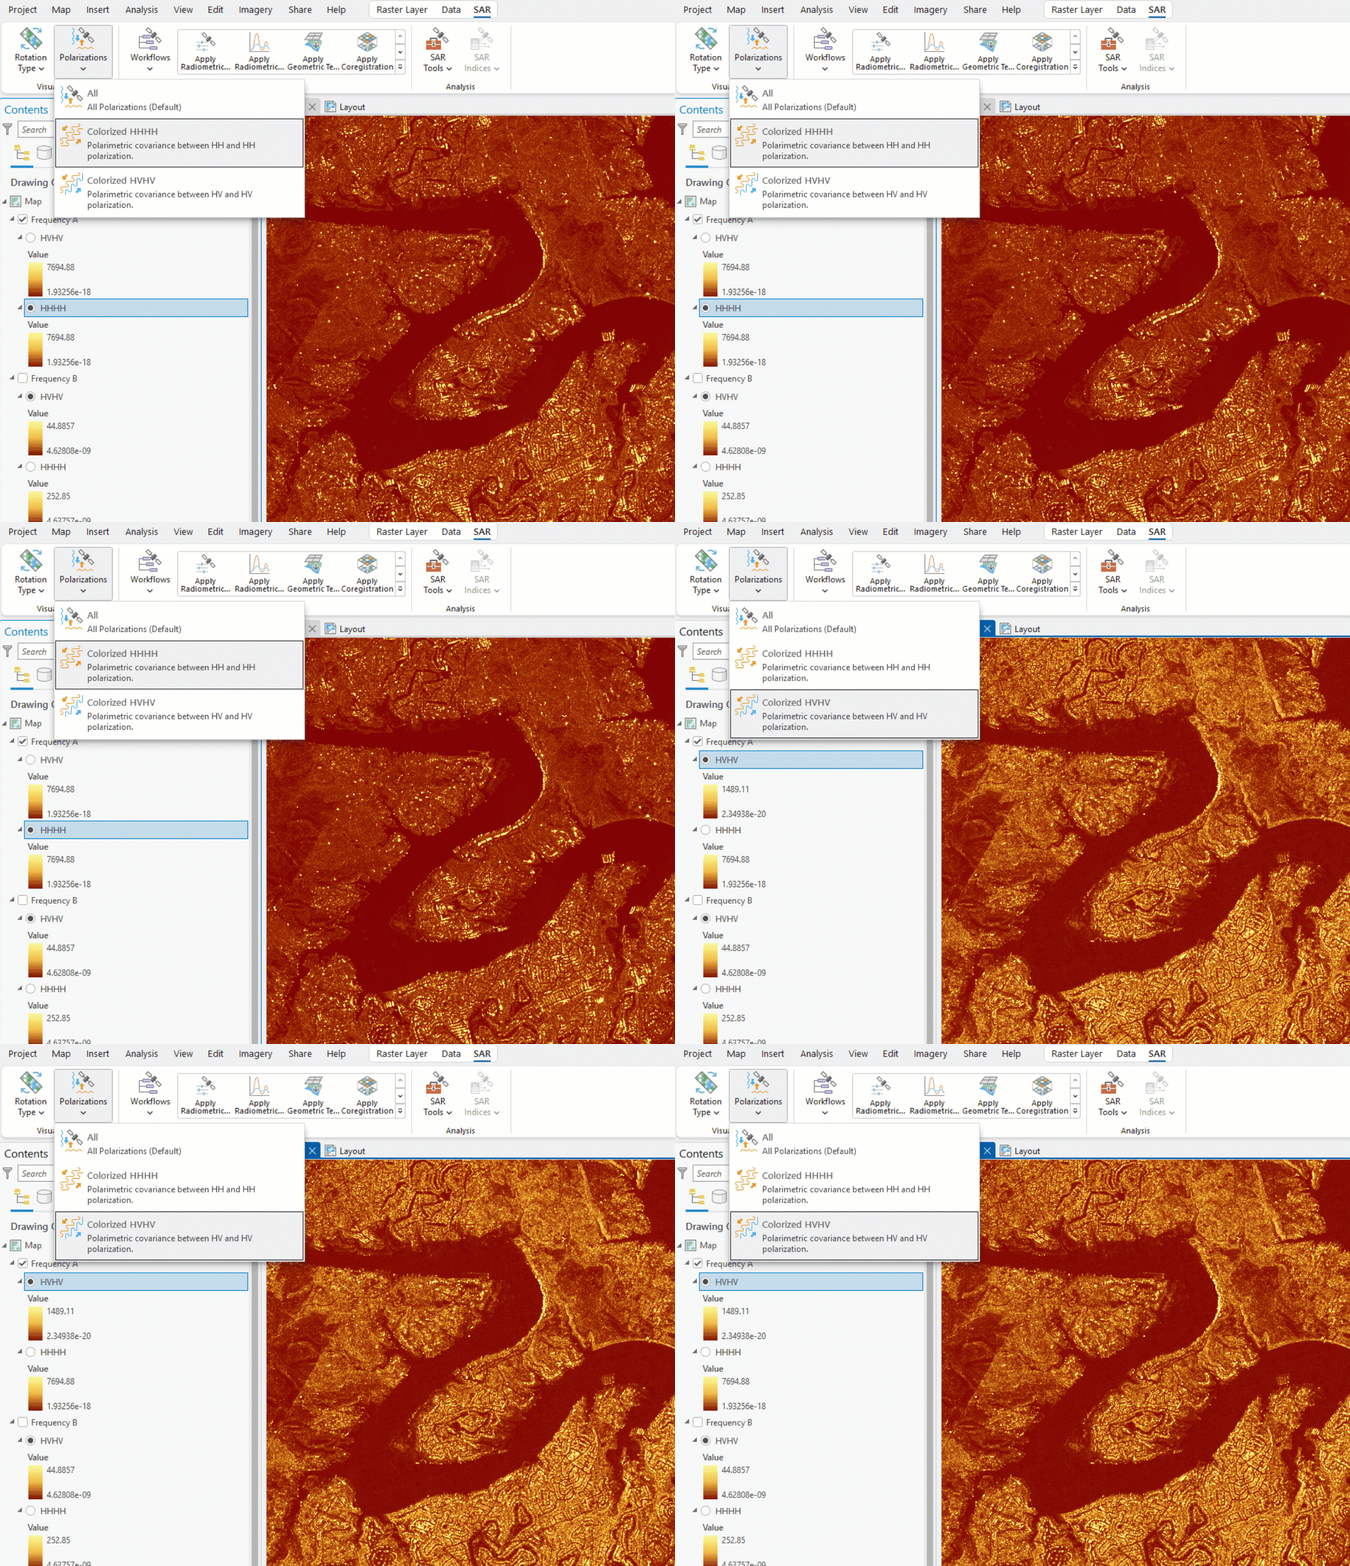
SAR signals can be transmitted and received in multiple polarizations (the orientation of the wave); typically either horizontal (H) or vertical (V). Different combinations of transmitting and receiving polarizations provide different information about the Earth’s surface. In ArcGIS Pro, navigate to Polarizations in the SAR tab to quickly swap between visualizations of the polarizations available in the selected product. Click here for NISAR symbology pane tips and tricks for visualization.
Data Processing
We recommend using GCOV products for GIS workflows because it’s already projected, radiometrically calibrated (adjusted for sensor response), terrain corrected (accounts for elevation differences) and the radar backscatter has been normalized to account for the influence of terrain on signal returns. This means you can skip processing steps that are listed in the SAR data processing tab in ArcGIS Pro that you’d typically apply to other SAR datasets. Processing steps that can be applied to GCOV are despeckle and unit conversion.
Data Analysis
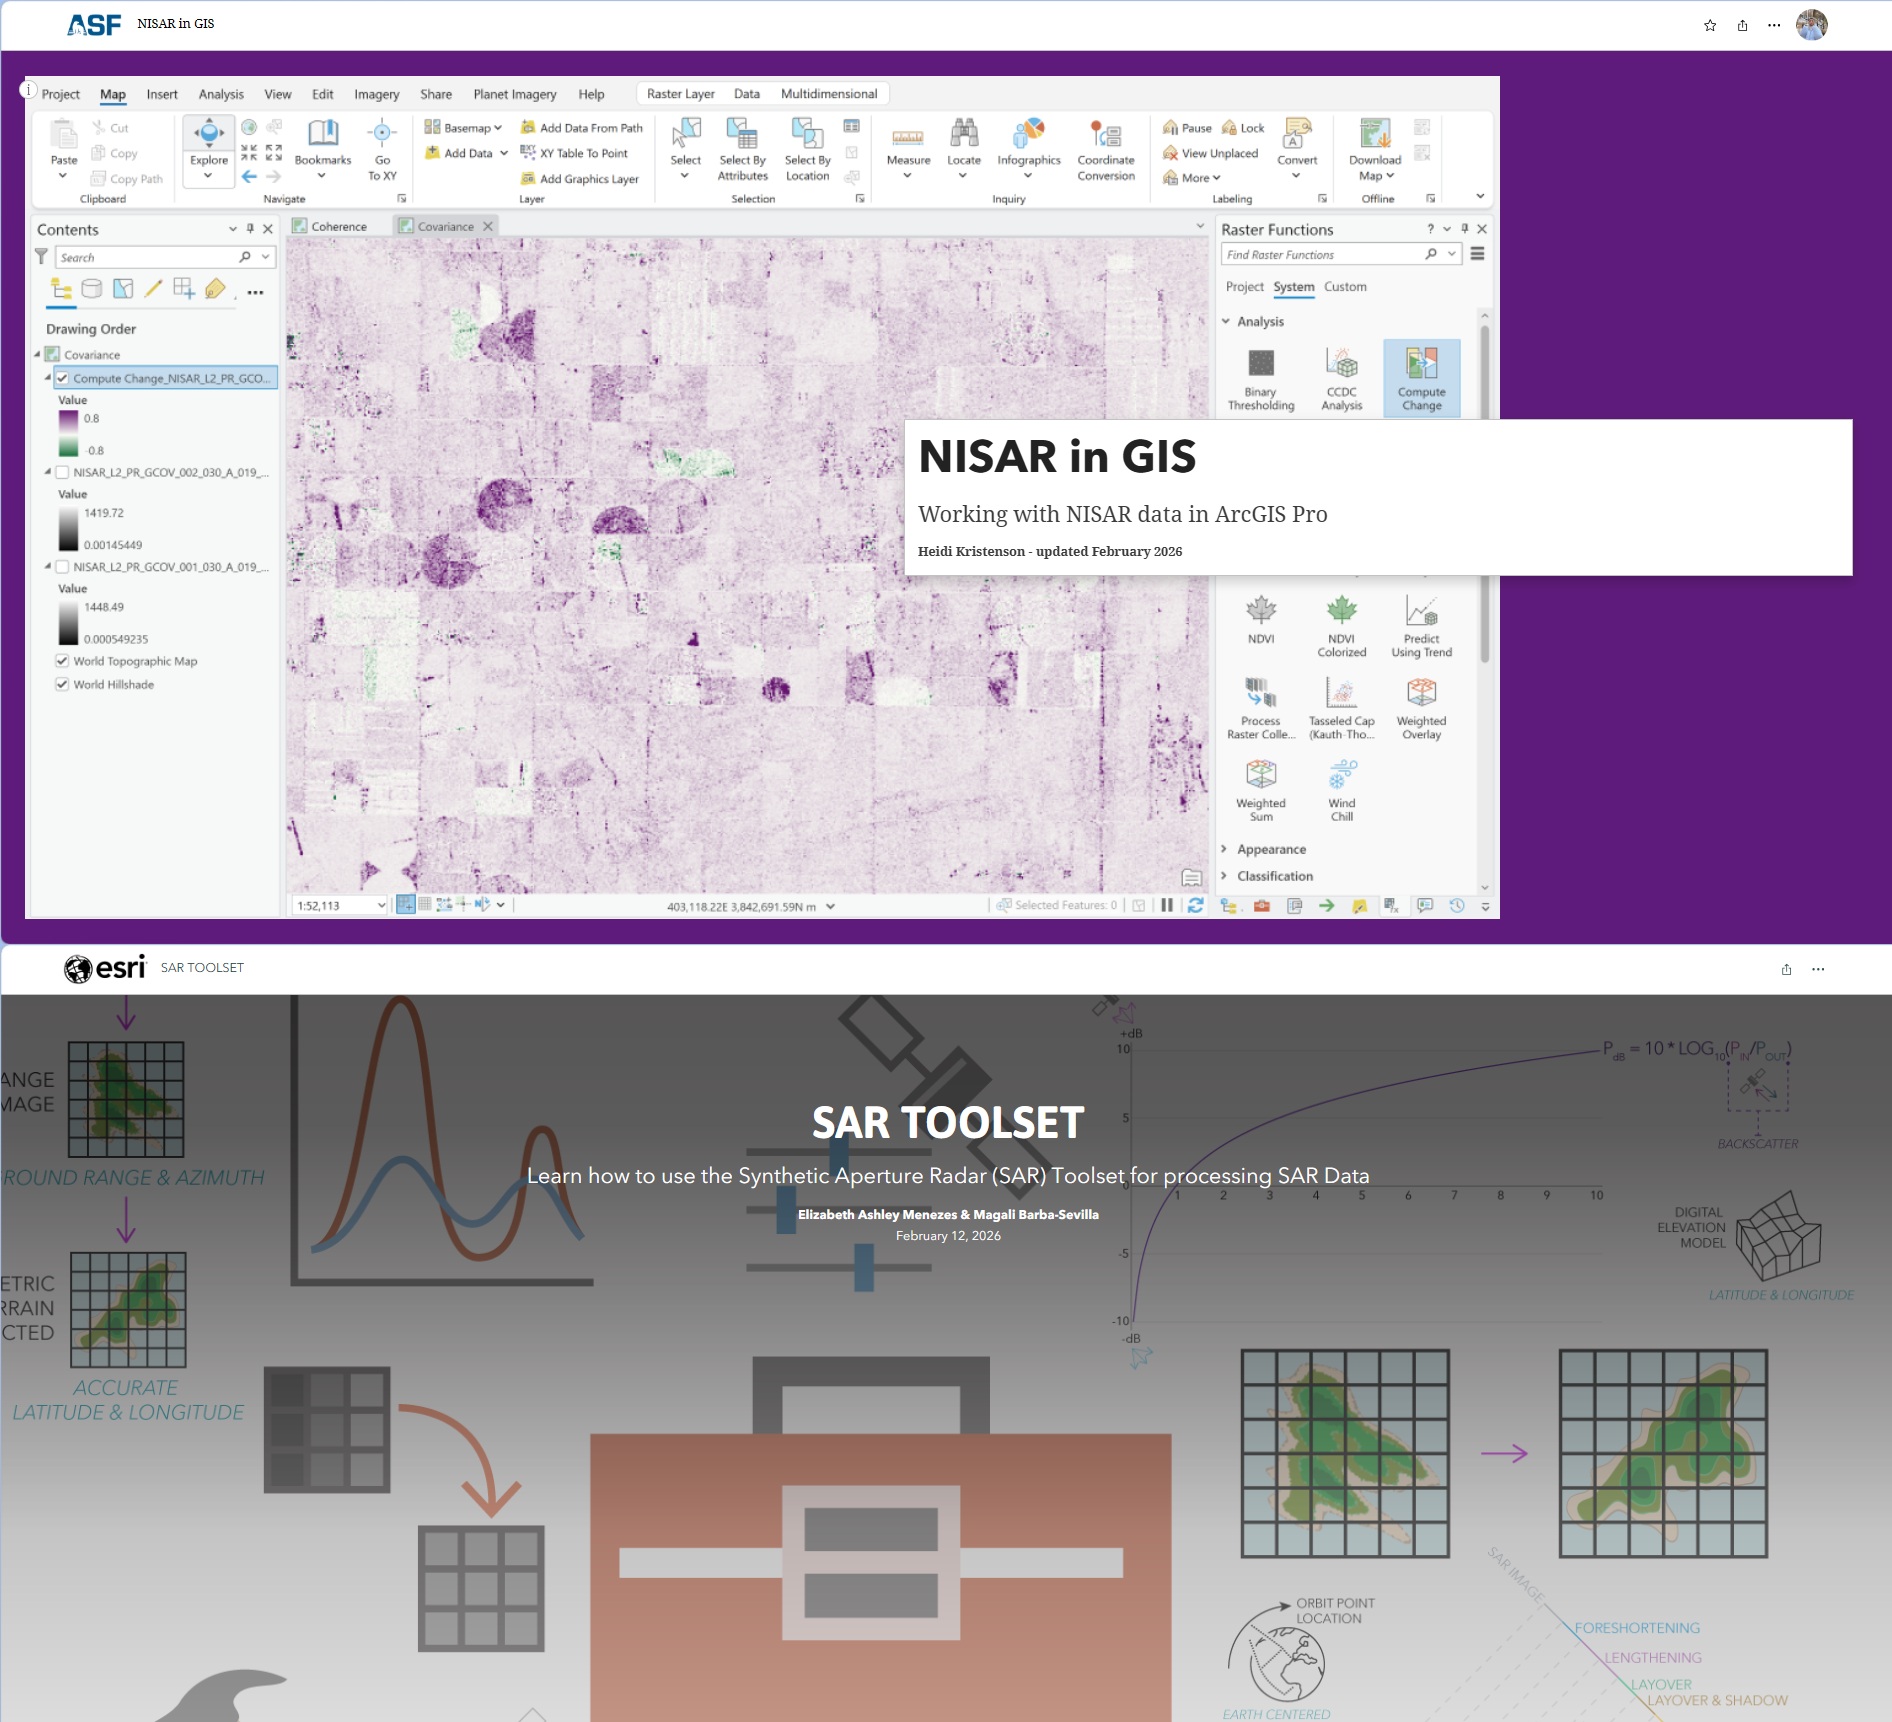
To learn more about working with a range of NISAR data products in ArcGIS, check out the NISAR in GIS StoryMap from the Alaska Satellite Facility. Learn more about NISAR, SAR basics, symbology tips and tricks, analysis with change detection, raster functions, and more! Aside from the SAR tab in ArcGIS, there are SAR geoprocessing tools. For advanced information about analysis with these tools, check out the SAR Toolset StoryMap.
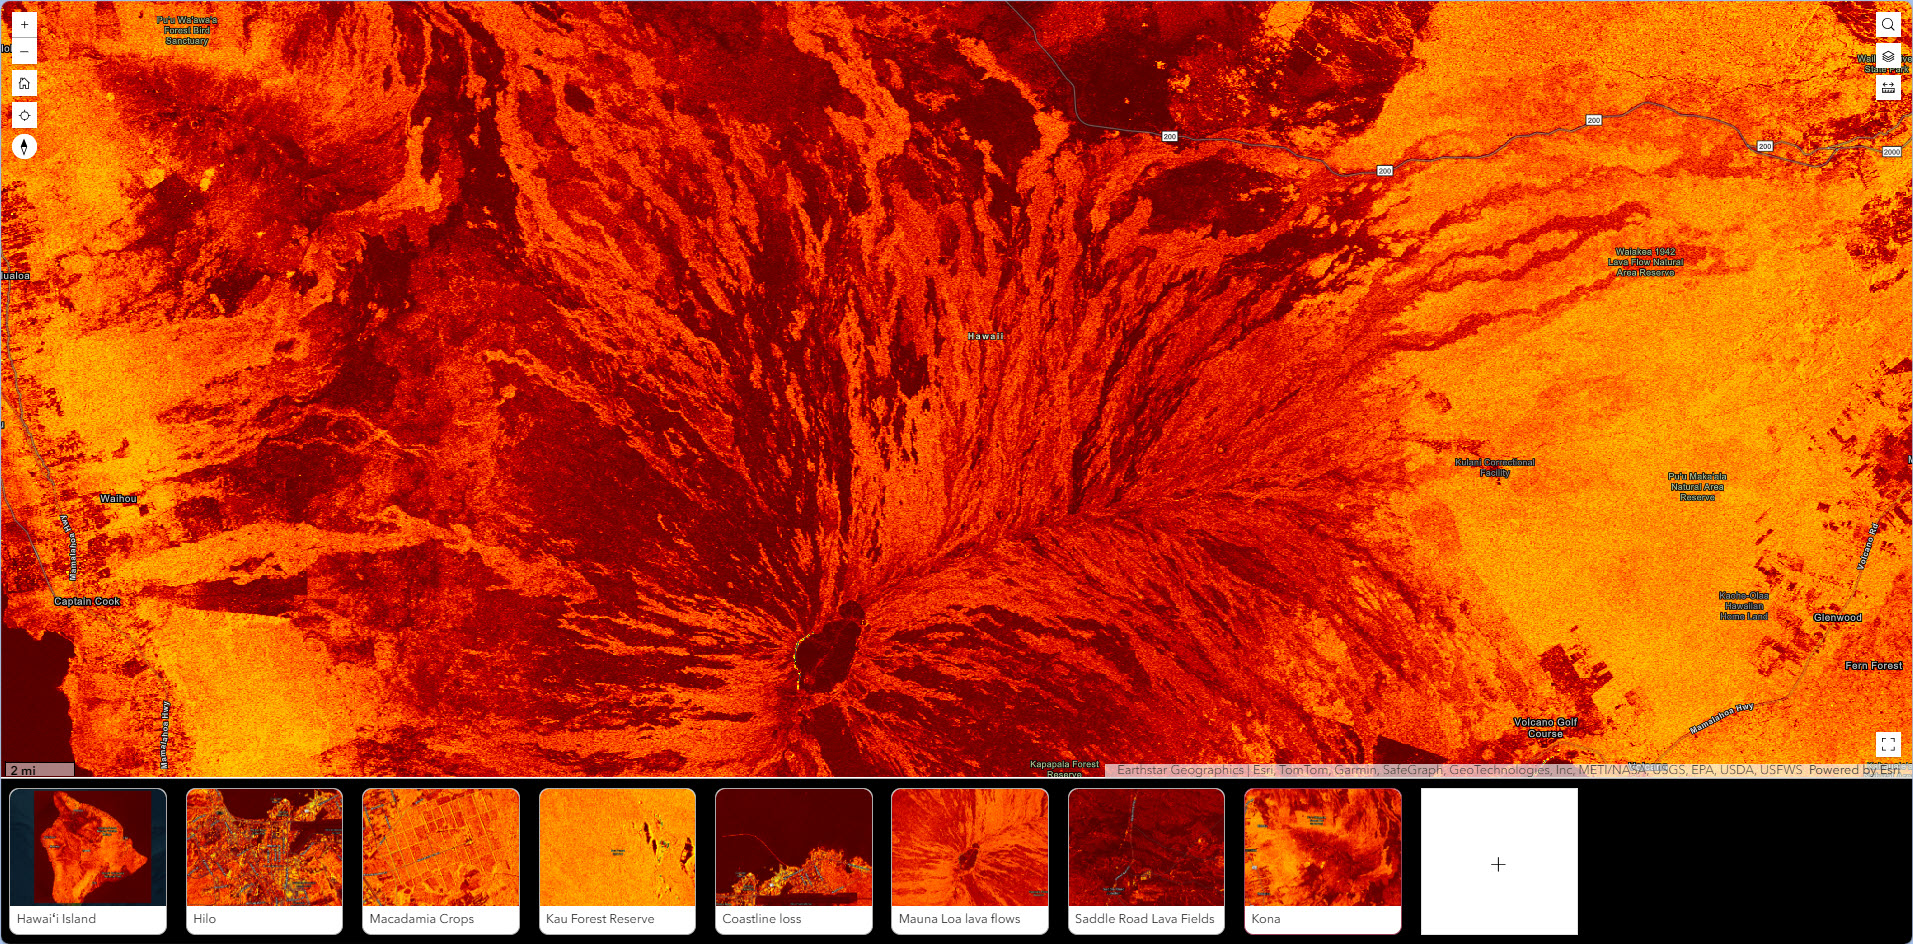
Interact with NISAR Data by Touring Environmental Features of Hawaiʻi Island
Ready to interact with NISAR data without downloading anything or leaving your browser? Let’s take a virtual trip to Hawaiʻi Island! In a single scene, we’ll tour active volcanoes, tropical rainforests, wetlands, coastlines, and urban areas. Hawaiʻi Island provides an awesome setting for exploring how NISAR reveals the structure and dynamics of Earth’s diverse environments.
What’s Next?! Further Resources 😊
I hope you enjoyed this introduction to NISAR data! If you would like to learn more, here are some additional resources:
- Beginner Friendly and Demystifying SAR blogs by Elizabeth Menezes: Elizabeth Ashley Menezes | ArcGIS Blog Author
- Getting started with SAR satellite imagery Esri tutorials
- Learn about NISAR Applications in NASA Jet Propulsion Laboratory’s StoryMaps.
- Python Tutorials for NISAR – NISAR Data User Guide
- We mostly touched on the L-band sensor in this blog. NASA provides access to the L-band products, but the NISAR mission also collects data with an S-band sensor. S-band data will be available from ISRO’s Bhoonidhi
- The NISAR mission generates many different data products. To learn more, refer to the NISAR Data User Guide.
- Get involved with the community with your findings and questions! Earthdata Forum – NISAR Data User Guide
Acknowledgements
Special thanks to Heidi Kristenson (ASF), Aote Xin (Esri), and Elizabeth Menezes (Esri) for reviewing this blog.

Article Discussion: