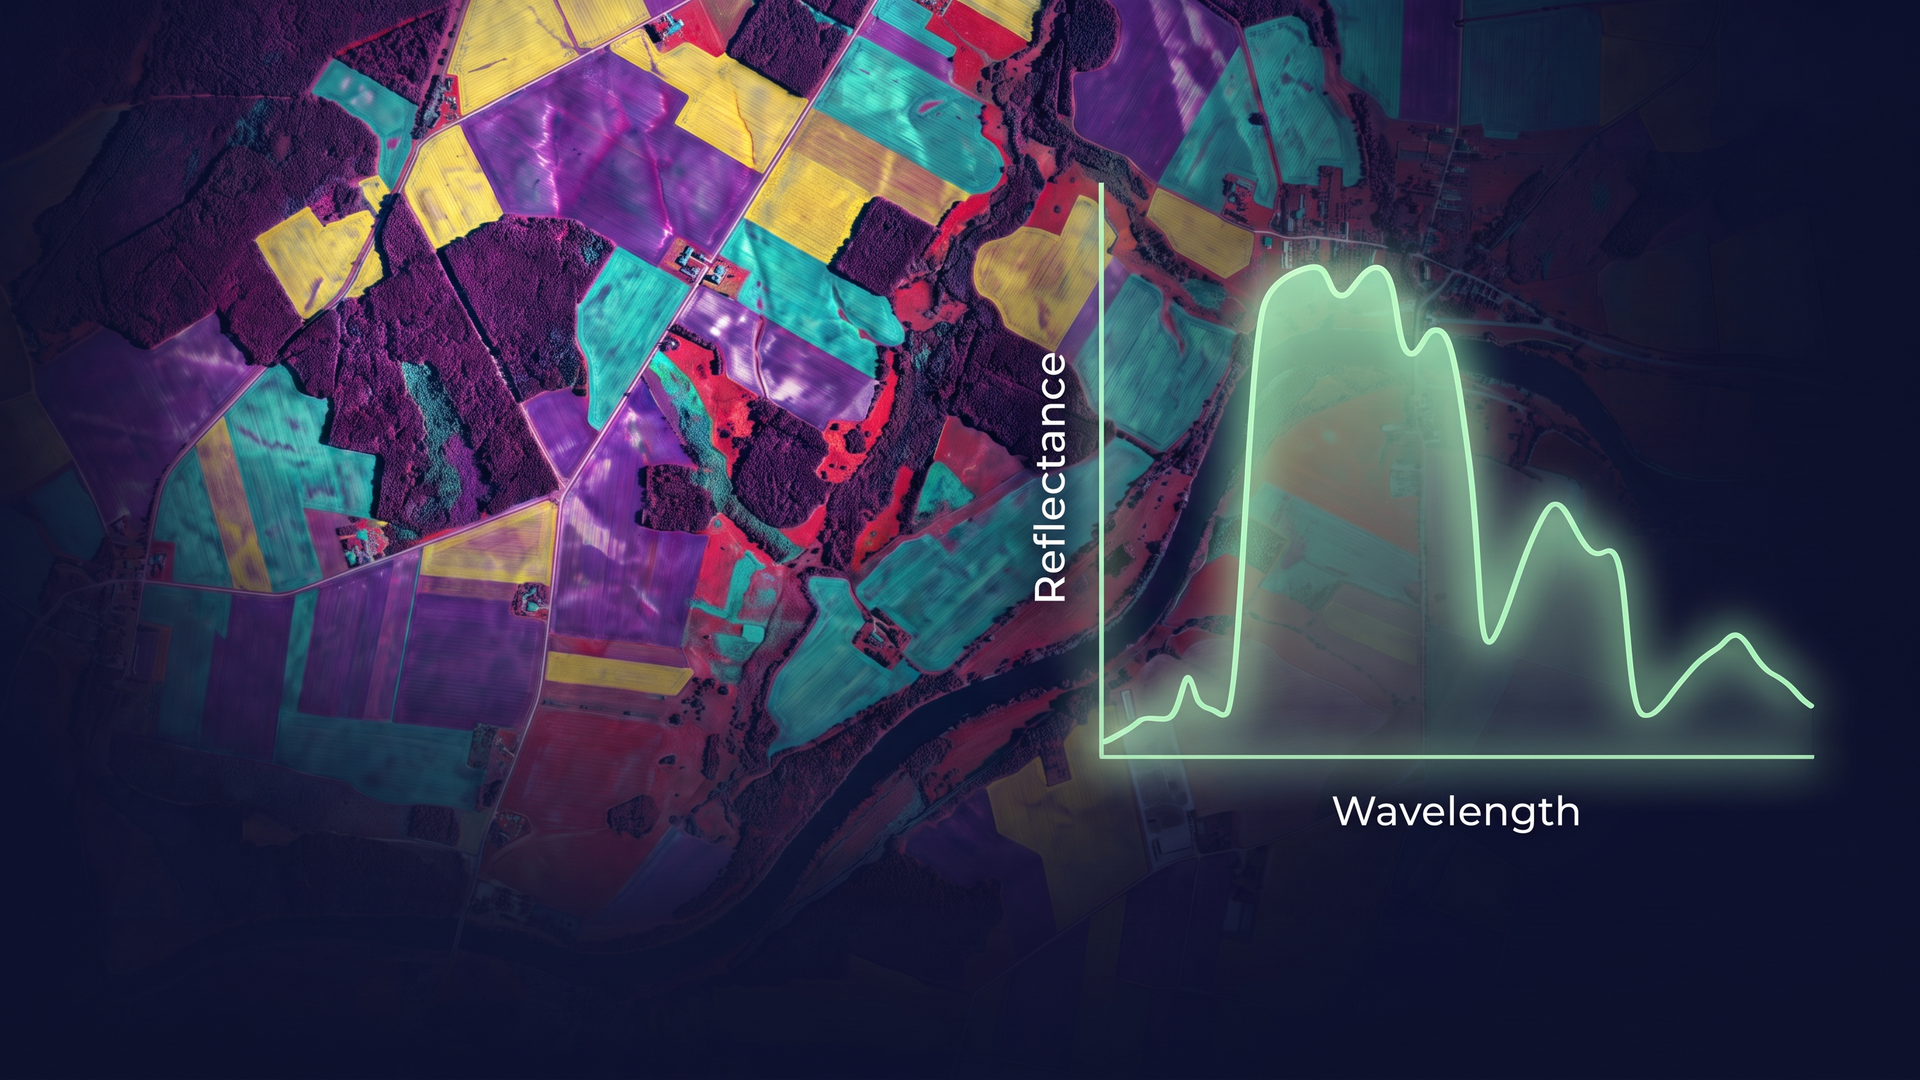
You already use imagery in ArcGIS to map, monitor, and understand the world around you. But some questions require more information than conventional imagery can provide. What if you could distinguish between materials that look similar and identify differences that reveal more about their properties and condition?
Hyperspectral imagery offers a way to explore these questions by capturing detailed information about how different materials reflect and absorb light across a range of wavelengths. This additional information creates new opportunities to analyze and characterize features across a wide range of applications, including agriculture, forestry, geology, environmental monitoring, and emergency response.
This article introduces the fundamentals of hyperspectral imagery, explores how it can provide deeper insight into the world around us, and lays the groundwork for a series of hands-on tutorials demonstrating how to work with and analyze hyperspectral data in ArcGIS.
Understanding Hyperspectral Imagery
Earth observation sensors capture information about the Earth’s surface by measuring reflected or emitted energy across different portions of the electromagnetic spectrum. The number and width of the spectral bands a sensor captures determine how much spectral information is available for analysis.
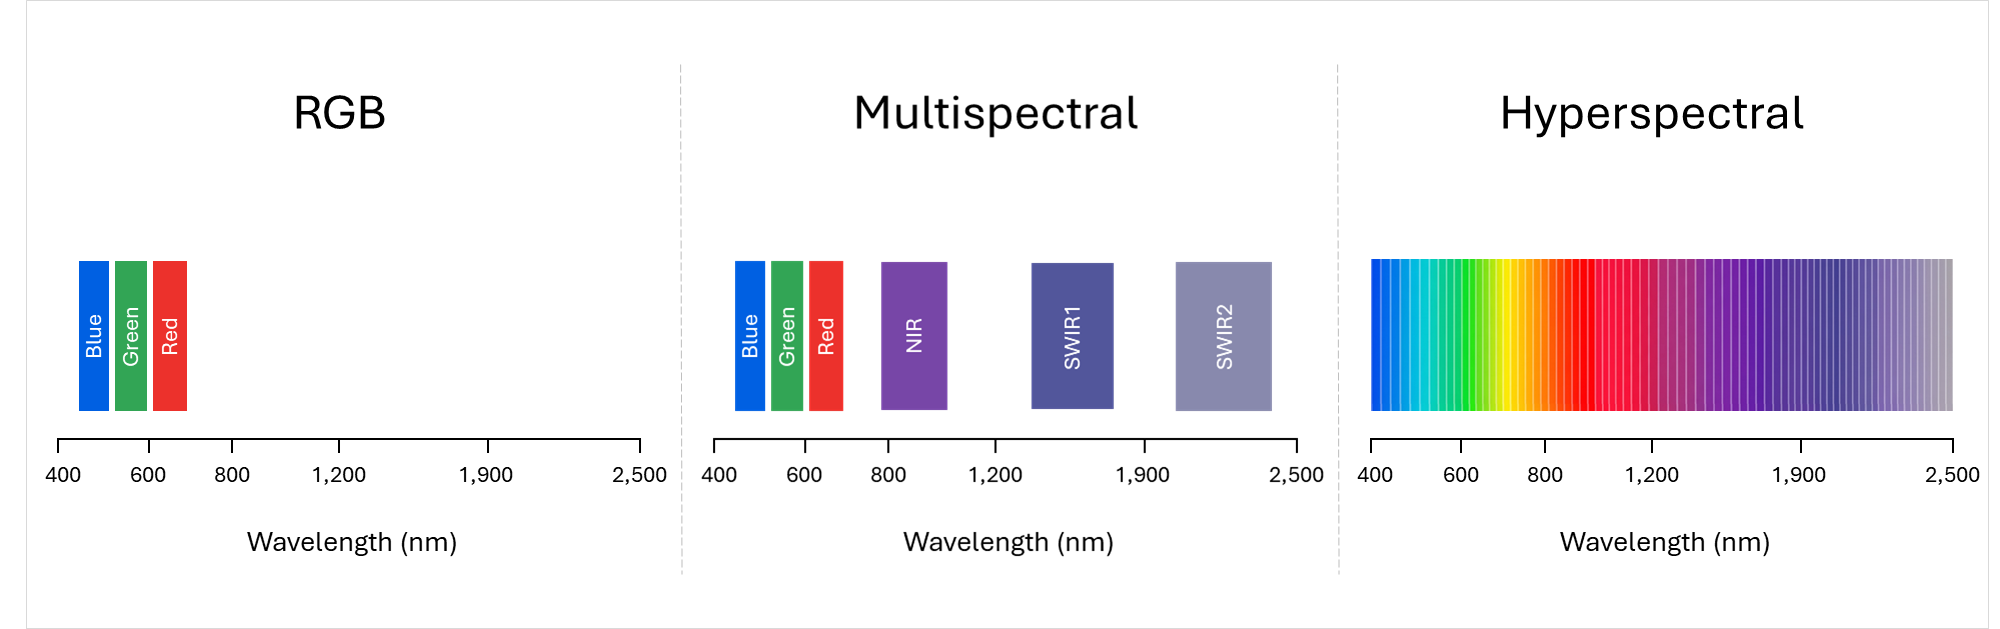
RGB imagery captures three broad bands in the visible portion of the spectrum: red, green, and blue. Multispectral imagery captures information in multiple discrete bands across selected portions of the spectrum, commonly including red, green, blue, and near-infrared bands, with some sensors also capturing red-edge and shortwave infrared bands.
Hyperspectral imagery takes this a step further by capturing many narrow, contiguous spectral bands across portions of the electromagnetic spectrum, typically numbering in the hundreds.
By capturing these finer spectral details, hyperspectral imagery enables analysts to look beyond the visible characteristics of a feature and examine subtle differences that can reveal more about its composition and condition. It can help reveal changes before they become visually apparent, distinguish materials that look alike, and flag unusual patterns that may otherwise go unnoticed.
Hyperspectral imagery can also complement other remote sensing data sources. RGB and multispectral imagery remain valuable for mapping and monitoring features across large areas, while hyperspectral data can provide a more specialized view when detailed information about materials or their condition is needed. Combining these sources can help analysts develop a more complete understanding of the landscape and make more informed decisions.
Every Pixel Tells a Hidden Story
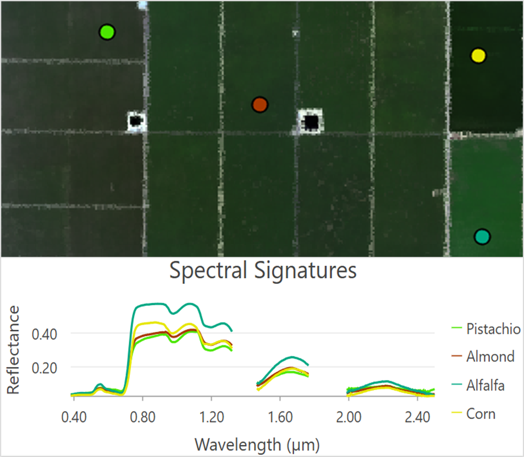
Every pixel in a hyperspectral image contains information about how the materials at that location interact with light. These interactions create patterns that can be used to distinguish one material from another. In hyperspectral imagery, these patterns are known as spectral signatures.
When a pixel’s spectral signature is plotted as a curve across different wavelengths, it reveals characteristic patterns that can provide clues about the type of material and its condition. Differences in physical and chemical properties influence these patterns, giving materials such as vegetation, water, soil, minerals, and man-made surfaces distinct spectral characteristics.
Spectral signatures are the foundation of many hyperspectral analysis workflows. Analysts can explore the spectra of pixels, compare them with known reference spectra, and use spectral libraries to help identify and characterize materials across an image.
Common Applications
Hyperspectral imagery supports a wide range of applications across several industries, including:
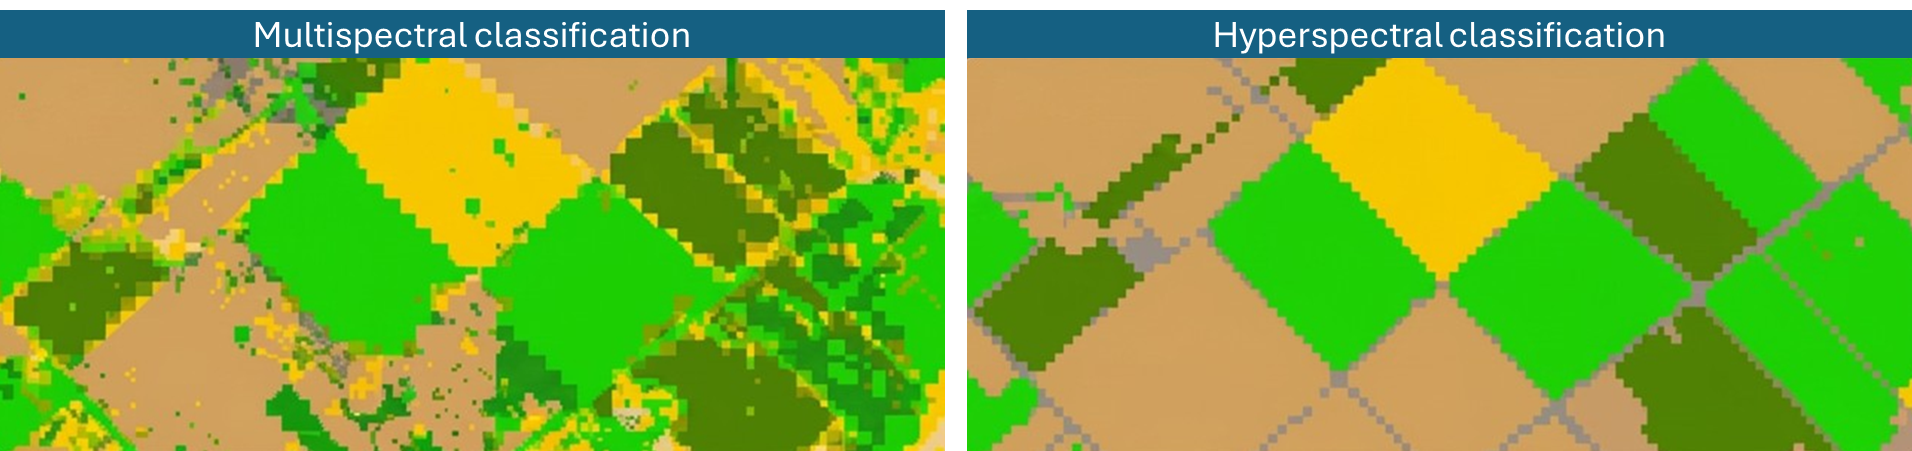
- Agriculture: Differentiate crop types and varieties, assess vegetation condition, and detect early signs of crop stress.
- Forestry: Characterize forest health, distinguish tree species, and monitor changes in canopy condition.
- Geology: Identify and map minerals, rocks, and soil materials to support geological surveys and exploration.
- Environmental monitoring: Assess water quality, characterize soil conditions, and monitor changes in ecosystems.
- Emergency response: Characterize burn severity, distinguish burned materials, and assess changes in vegetation and soil conditions following wildfires.
Although these applications span very different fields, they share a common foundation: using detailed spectral information to distinguish, characterize, and monitor materials.
Hyperspectral Imagery in ArcGIS
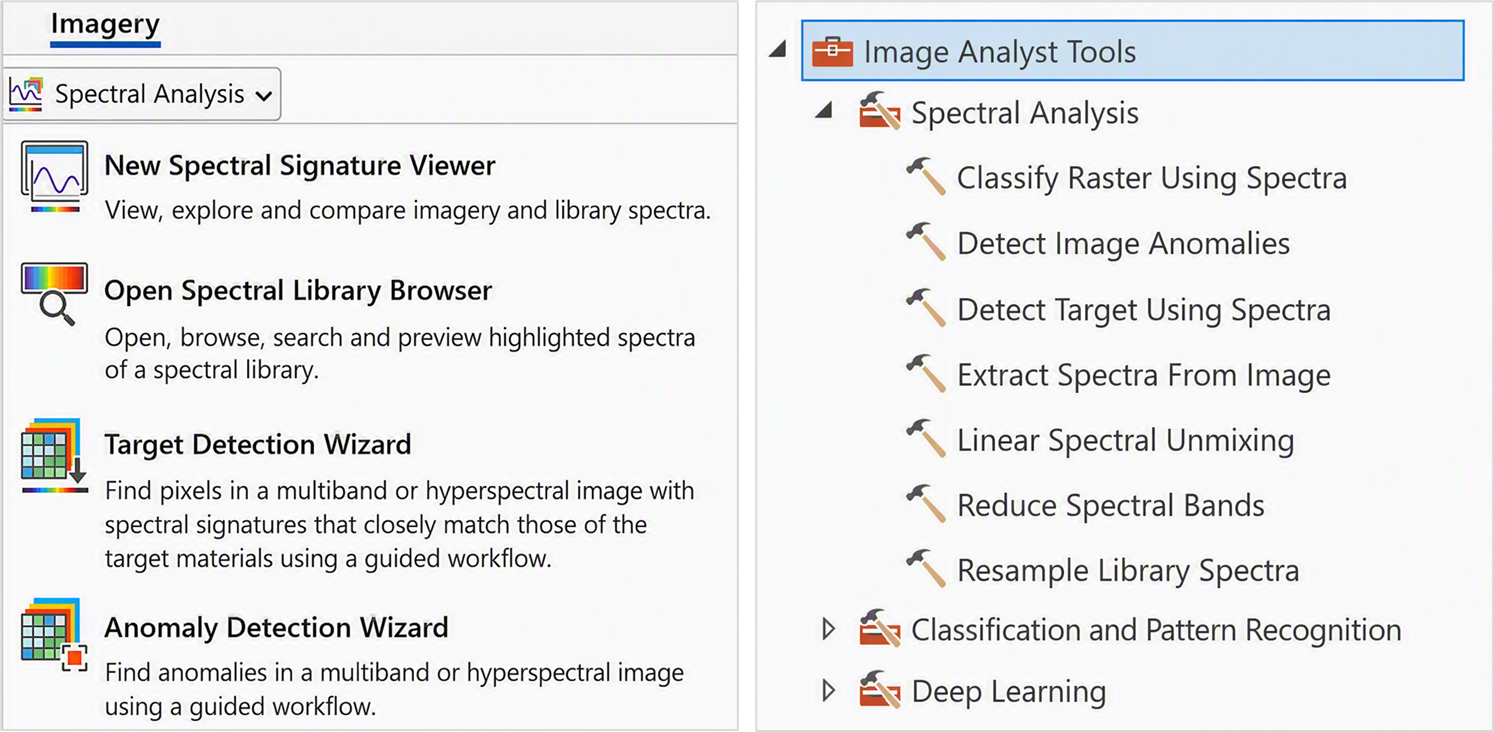
ArcGIS provides tools and workflows for exploring the rich spectral information in hyperspectral imagery and using it to better understand materials and conditions on the ground.
Explore:
- Create and compare spectral signatures from image pixels
- Browse and preview spectra from spectral libraries
Analyze:
- Detect specific materials using known spectral signatures
- Identify anomalies with unusual spectral characteristics
- Estimate materials within mixed pixels using spectral unmixing
- Reduce spectral complexity while preserving key information
- Classify imagery and identify patterns using machine learning
These capabilities build on familiar imagery analysis concepts in ArcGIS while taking advantage of the much richer spectral information available in hyperspectral data.
Hyperspectral Imagery Tutorials
Ready to put these concepts into practice?
Explore our growing collection of hyperspectral imagery tutorials, featuring hands-on workflows for exploring and analyzing hyperspectral data in ArcGIS. The tutorials cover foundational spectral concepts and a range of analytical techniques, using real-world datasets to demonstrate how to work with hyperspectral imagery.
Whether you are new to hyperspectral imagery or looking to expand your remote sensing skills, these tutorials offer a practical way to build your knowledge and explore spectral analysis in ArcGIS.
Conclusion
Hyperspectral imagery provides another way to understand the world through remote sensing, revealing spectral differences that may not be apparent in conventional imagery.
With tools in ArcGIS for exploring spectral data and applying a range of analytical techniques, you can begin to investigate these differences and incorporate hyperspectral imagery into your remote sensing workflows.
The growing collection of hyperspectral imagery tutorials offers a practical starting point, with hands-on workflows using real-world datasets to help you build your skills and apply spectral analysis to your own projects.

Article Discussion: