Starting ArcGIS Pro 2.8, authoring this kind of layers is made very easy using Make Aggregation Query Layer. Please read about this in the following blog and ArcGIS Pro help:
- Make Aggregation Query Layer – a new geoprocessing tool to compute and view dynamic summary statistics from related records
- https://pro.arcgis.com/en/pro-app/latest/tool-reference/data-management/make-aggregation-query-layer.htm
Let’s say you have some point data representing crime data, 311 calls, tornadoes across the nation, sales, or earthquakes around the world, and you want to explore data concentration, patterns, or trends—maybe over time or maybe using different criteria as you’d do in an exploratory analysis. Simply drawing these points on a map might not help reveal any meaningful information, since most of them will overlap and obscure each other. One approach we could use to reveal meaningful information is to aggregate points within known geometry boundaries such as districts, cities, and counties etc.
We could use some geoprocessing tools to get to the same results, but they are static. If data changes or we want to use different criteria for analysis, we’d need to run those tools again. This makes sharing your geoprocessing results hard too via web.
With the approach described in this blog, we need to setup once and then start interacting with the layer or map properties to make necessary changes and view the results right away on the map.

In this blog, we will work with crime locations and learn how to aggregate them within police district boundaries to help us explore the following:
- Spatial patterns
We will also learn how to setup the layer to explore pattern based on the following:
- Month
- Day of the week
- Time of the day
- Crime type
Prepare the Data
Let’s get started:
- Download an ArcGIS Pro package to get started with sample data.
- Double-click the package file that you downloaded to open in ArcGIS Pro.
- The Crimes map contains (1) a point layer representing crime locations and (2) a polygon layer for police districts.
- The Crime layer has a field, PDDistrict, that will be used to join crime locations to police districts.
- Create a new database connection to your enterprise database such as SQL Server, Oracle, PostgreSQL or other database supported in ArcGIS Pro.
- Go to the Catalog pane and navigate to Databases\Crime.gdb.
- Copy both feature classes from the file geodatabase to your enterprise database.
Transform Crime Locations into District Polygons
You are a geographic information system (GIS) analyst and you are tasked to produce a map for the police chief, showing districts with crime totals. You have a point feature class showing locations of all crimes occurred in the city and a polygon feature class for police districts. We will follow the steps below to create a query layer to produce such map in this section. In the following section, we will add few additional parameters to make the layer produce different results based on different inputs.
Follow the steps below to create the layer:
- Click the Query Layer option from the Add Data command on the Map tab.
- Select your database connection.
- Give it a name such as Crime by Districts.
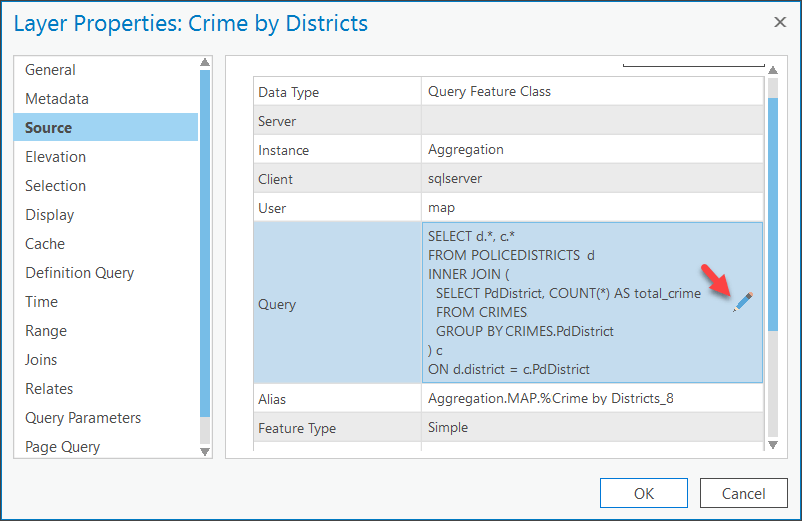
- Copy the following query and paste it in the Query text box:
SELECT d.*, c.*

FROM POLICEDISTRICTS d

INNER JOIN (

SELECT PdDistrict, COUNT(*) AS total_crime

FROM CRIMES

GROUP BY CRIMES.PdDistrict

) c

ON d.district = c.PdDistrict - Symbolize the layer appropriately. Optionally, you may label district boundaries with the total_crime attribute.
You will see a map looking something like the one shown above.
Note: Values in this field get computed dynamically every time you refresh the map. Therefore, when new data are added, results showing on the map gets updated in the next map refresh. You don’t need to modify or recreate the layer.
Find Out if Crimes Happen on Weekends
The above map made the police chief happy and even district commissioners found the map very helpful. Now the person in charge of crime analysis came in and asked you to help them find out whether there are correlations between crimes that occur on weekdays and those that happen on weekends. Since you chose to create a query layer in the section above, meeting the crime analyst’s needs will be easy. Let’s follow the steps below to create a crime map for different days of week:
- Open the Layer Property page of the query layer created earlier and click its Source
Click the blue pencil icon to open the Edit Query Layer dialog box.
Insert the following WHERE clause with a range parameter right after the table name CRIMES:
WHERE ::r:DayOfWeekRange

- Click the pencil icon to bring up an inline editor to define the parameter.
- Fill in all the necessary information as shown in the following screenshot.

- Field or Expression—Type “datepart(dw, datetime_)”.
Note: DatePart() is a SQL Server function that extracts the day of the week from a date value. Other databases have similar functionalities, but their names and syntax may differ. If you want to find crime pattern by hour of the day, use “datepart(hh, datetime_)” - Data Type—Choose Integer.
- Default value—Uncheck the check box.
- Name of the table the field belongs to—Type “Crimes”.
- Click Done.
- Validate the SQL query layer.
- Click Next.
- Click Finish.
If you click the Range tab on the Layer Properties page now, you will see that the range settings got automatically defined. When you define a range parameter of the integer or double data type, the layer is automatically made range aware and will start honoring the map’s range slider’s settings.
- Click OK.
The range slider appears on the right side of the map.
- Enable the range slider from the Range
Have Single Value checked, and Step Interval set to 1.

On the range slider, you can navigate between different days of the week (where 1 = Sunday and 7 = Saturday). Note: This may vary based on database flavor and locale settings, etc.

Visualize Patterns for Specific Crime Types
The map above made the crime analyst’s job more efficient. They realized the importance of dynamic nature of this map and layer, and came back with a new requirement – produce the same map but for specific crime type instead of all crimes. Query layers are flexible enough for that too.
- Open the Layer Property page of the query layer again and click its Source
- Click the blue pencil icon to open Edit Query Layer dialog box.
- Insert the following discrete parameter in the WHERE clause:
WHERE ::r:DayOfWeekRange AND (CATEGORY IN ::CategoryVar )

Note: Please make sure to have a space between “::CategoryVar” and the closing parenthesis, otherwise you will run into a bug.
- Click the pencil icon to bring up an inline editor to define the parameter.
- Fill in all the necessary information as seen in the following screenshot:

-
- Allow multiple values—Check the check box.
- Data Type—Choose String.
- Default value— copy-paste the following text as it-is in the text box.
DRUG/NARCOTIC, BRIBERY/EXTORTION, BURGLARY/THEFT, WEAPON LAWS, NON-CRIMINAL, FAMILY OFFENSES, DUI/DRUNKENNESS, SUICIDE, ARSON, VEHICLE THEFT, VANDALISM, DISORDERLY CONDUCT, ASSAULT, GAMBLING, MISSING PERSON/RUNAWAY, OTHER OFFENSES, FORGERY/FRAUD, KIDNAPPING, SEX OFFENSES, SEX OFFENSES, FORCIBLE, WARRANTS
- Click Done.
- Validate the SQL query layer.
- Click Next.
- Click Finish.
Choose Query Parameters on the Layer Properties page.

- Check the BURGLARY/THEFT check box.
- Click OK.
- The map will show the burglary/theft total for each district.
- Notice that the range slider is still active and that the layer is actually showing burglary/theft totals for that specified day of week, selected on the range slider, for each district.
You can disable the range slider to view results for all days not just for a single day.

Note: since you are using aggregated results for crime of specific type rather than all, the value ranges have changed. You may need to use Refresh Values on the Symbology pane.
Use the Time Slider
Months or may be years went by since you made crime analysis dynamic. It made the police and analysts more efficient and they think crime rate might have been decreasing. Now, you need to make a map to show the total number of crimes by month or year or weeks.
- Go back to the layer’s Source tab, then click the blue pencil icon to open the Edit Query dialog box.
- Add a new range parameter of Date data type as seen in the following screenshot and follow the same steps provided earlier.
- Field or Expression—Type “DateTime_”.
- Data Type—Choose Date.
- Default value—Uncheck the check box.
Name of the table the field belongs to—Type “Crimes”.

- This will bring up the time slider on the map view.
- If you can choose a month or year or week as the Time Span
- Step through the time on the time slider to view districts with dynamically computed result for that time period.
You can combine all criteria such as time span, day of week, crime type or use any combination of them to analyze and produce crime map very easily and interactively. And of course, the results are always up-to-dated with the latest crime data.
Share Your Result in Web Maps
You can share the map as a map image layer (or map service) with some limitations:
- When you consume such map services on a web application such as ArcGIS Online or a portal map viewer or a Web AppBuilder for ArcGIS application, you can only use the time slider to make use of date data type range parameters.
- To use range parameters of integer or double data type, or discrete parameters, you need to develop a custom ArcGIS API for JavaScript application.

Article Discussion: