This blog is more of a hands-on tutorial. If you want to know more on the concept etc., please read this blog that I wrote a while back.
One important point before we begin, you must have an enterprise database such as PostgreSQL, SQL Server, Oracle etc. The function that I’m using below to generate line from points is specific to SQL Server. The SQL statements in general should work for other databases expect for that function. Please consult to your database help to find the equivalent one.
Let’s dive in…
Overview:
Let’s start by opening a layer package (https://arcg.is/1H9vT8) in ArcGIS Pro. When it is opened, you will see some points on the map.
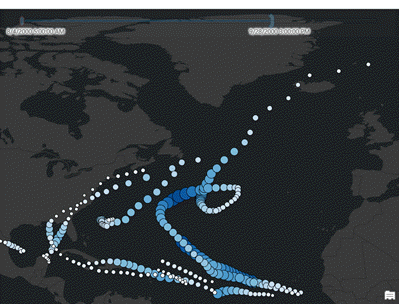
First thing we want to do is to generate lines from all point features belong to each hurricane just like below.
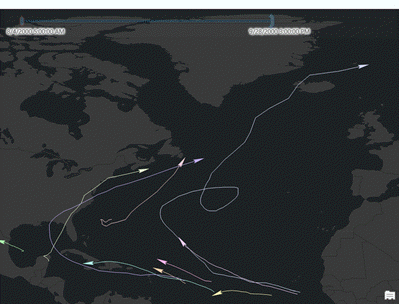
Second, we will make the layer a time aware layer and generates lines using only points from any time range.
Finally, we will compute some statistics such as current wind speed, min/max wind speed during that period, and number of points used to generate each line.
Create lines from points on the fly:
- Use Feature Class to Feature Class (or right-click the layer in ArcGIS Pro Contents pane and choose Data | Export Features) geoprocessing tool to export all features in a feature class inside an enterprise database.
- name the output feature class Atlantic_Hurricanes_2000.
- On the Map tab, in the Layer group, in the Add Data menu, click Query Layer.
- Select your enterprise database connection from the Connection drop down box.
- Provide a name.
- Copy/paste the SQL from below in the Query text box.
SELECT objectid, eventid, shape, vertex_count as nos_points, shape.STLength() AS shape_length
FROM
(select EVENTID,
convert(int, ROW_NUMBER() OVER (ORDER BY EVENTID)) as objectid,
iif(count(*) < 2, null, geometry::STLineFromText(
concat(‘LINESTRING (‘,
string_agg(concat(shape.STX, ‘ ‘, shape.STY), ‘, ‘) within group (order by Date_Time asc),
‘)’), 4326)) as shape,
count(*) as vertex_count
from Atlantic_Hurricanes_2000
group by EVENTID) x - Click Validate.
- Click Next.
- Have the checkbox next to objectid checked.
- Make sure all the information below is correct.
- Click Finish.
- You will see a line feature layer added in your map. Each line feature represents track for a single hurricane.
- If you want you can symbolize with them unique value renderer using EVENTID field.
Make the layer time aware
- Open the layer Properties page.
- Switch to the Source tab.
- Click the pencil icon on the right side in the Query row.
- It will open the Query Layer editor.
- Add the following line right before the very last line i.e “group by EVENTID) x”.
WHERE ::r:time
- You will see a pencil icon show up. Click it.
- Enter date_time in the Field or Expression text box.
- Pick Date from the Data Type drop down.
- Uncheck Default value.
- Expand the Advanced section
- Enter Atlantic_Hurricanes_2000 the text box next to ‘Name of the table the field belongs to’ label
- Click Done.
- Click X to close this inline editor.
- This adds a range parameter of date type.
- Follow step#6 – #10 from above.
- Once finished, you will see the the time slider showed up on your map
- If you check the Time tab on the layer’s Properties page, you will see that the layer is made time aware automatically just because you added a range parameter.
- You can use the time sliders setting to navigate to any time window and see hurricane paths generated for that time window.
Add other summary statistics results to each line
- Open the Query Layer editor from the layer Properties page as we did in the section above.
- Delete everything from the Query text box.
- Copy/paste the SQL from below.
SELECT
objectid, x.eventid, shape, vertex_count as nos_points, shape.STLength() AS shape_length,
max_windspeed, MIN_windspeed, y.latest_windspeed
FROM
(
select EVENTID,
convert(int, ROW_NUMBER() OVER (ORDER BY EVENTID)) as objectid,
iif(COUNT(*) < 2, NULL,
geometry::STLineFromText(
concat(‘LINESTRING (‘,
string_agg(concat(shape.STX, ‘ ‘, shape.STY), ‘, ‘) within group (order by Date_Time asc),
‘)’), 4326)) as shape,
count(*) as vertex_count,
MAX(windspeed) as max_windspeed, MIN(windspeed) AS MIN_windspeed
from ATLANTIC_HURRICANES_2000
where ::r:datetime
group by EVENTID
) x
inner join
(
select eventid, latest_windspeed from
(
select eventid, windspeed as latest_windspeed,
ROW_NUMBER() over (partition by eventid order by date_time desc) as row_id
from ATLANTIC_HURRICANES_2000
where ::r:datetime
) y2
where y2.row_id = 1
) y
on x.eventid = y.eventid - Follow step#6 – #15 from above.
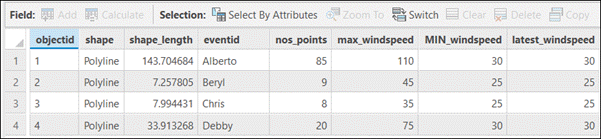
- Once finish updating the layer, you can open its attribute table and you will see some summary statistics such as # of points, max_windspeed, min_windspeed and lastest_windspeed.
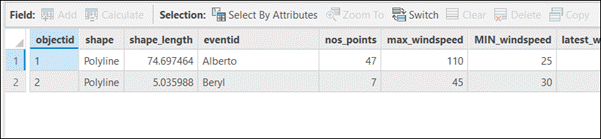
- Modify the time slider time range and you will see these values get updated. And you might even see more or less # of records depending on how many hurricanes were there during that time.
I hope you have found this helpful. And if you need to share this out, publish/share it as a map service/map image layer on your standalone server or enterprise portal respectively.

Article Discussion: