Here is an animation showing the positions of Antarctic icebergs through time. But it’s a little sneakier than just a regular animate through time sort of view. This animation lets us put on Time Lord goggles to see an impossible cross section by month over a vast time span. So like 40 years of January positions, 40 years of February positions, etc. This gives us a neat sense of seasonal movement of Antarctic icebergs.
Some of the most interesting time visualizations are arrived at by creating not-necessarily-chronological cross-sections of time.

This is part 2 (of 2 parts…the stunning conclusion) of an Antarctic iceberg mapping series. In part 1 we learned how to achieve this cartographic look in ArcGIS Pro. Now it’s time to put on our berets and create a moving picture! So kick back in your director’s chair and let the waves of an animation how-to wash over you…
For the less video-inclined among us (which is actually pretty ironic given the topic, but to each their own), here is a pictorial step-through in 5 steps.
Step Nil (wink). Look and Feel
Check out Part 1 of this series where I show you how to speed rapidly away from defaults to get the data looking more suitable to its phenomenon.
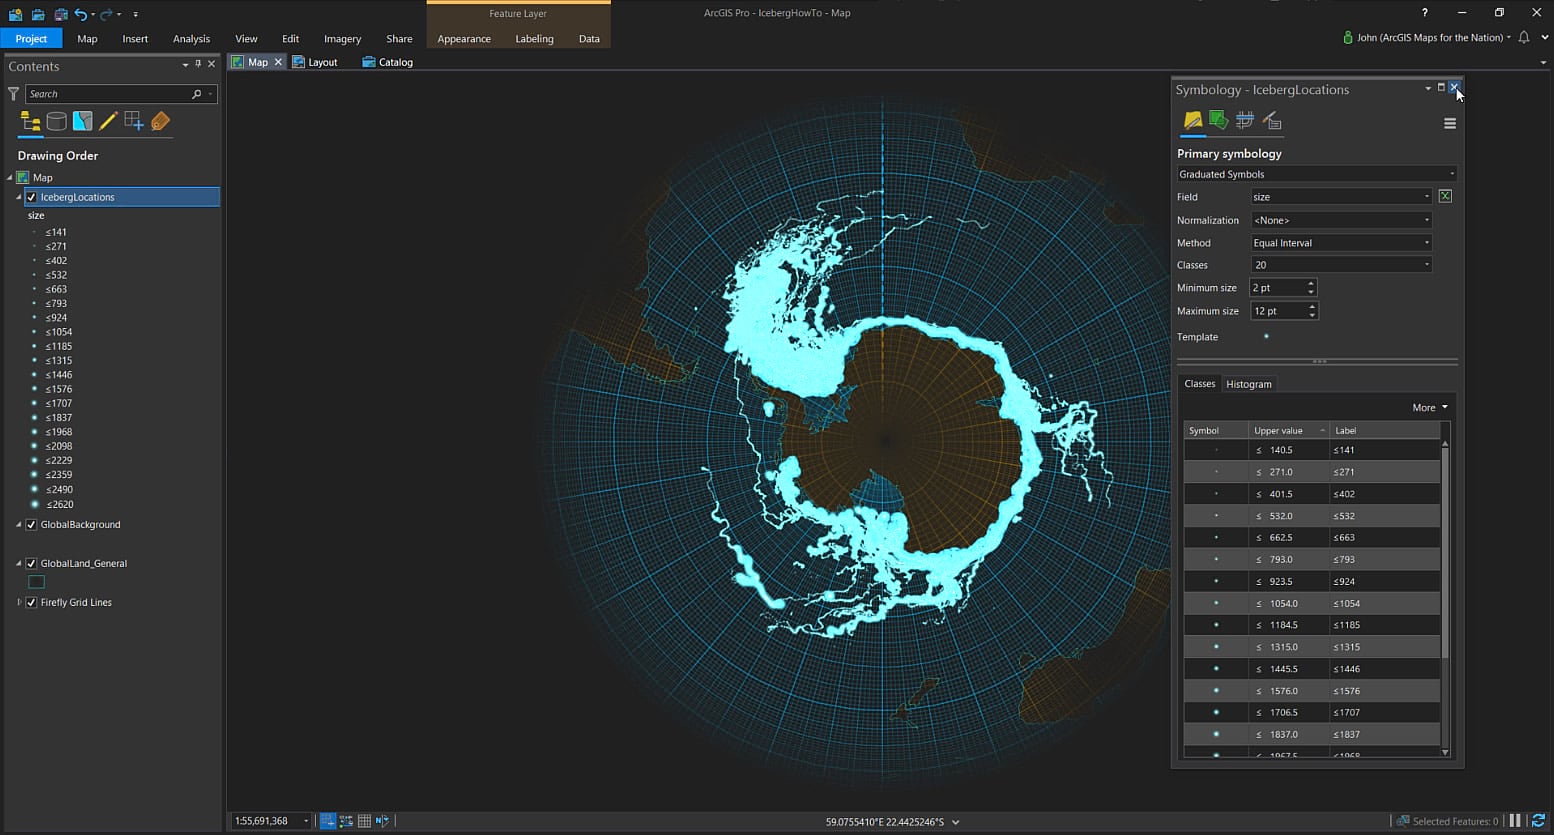
Step 1. Symbology
I used a graduated symbology to show smaller and larger icebergs as smaller and larger glowing Firefly points.
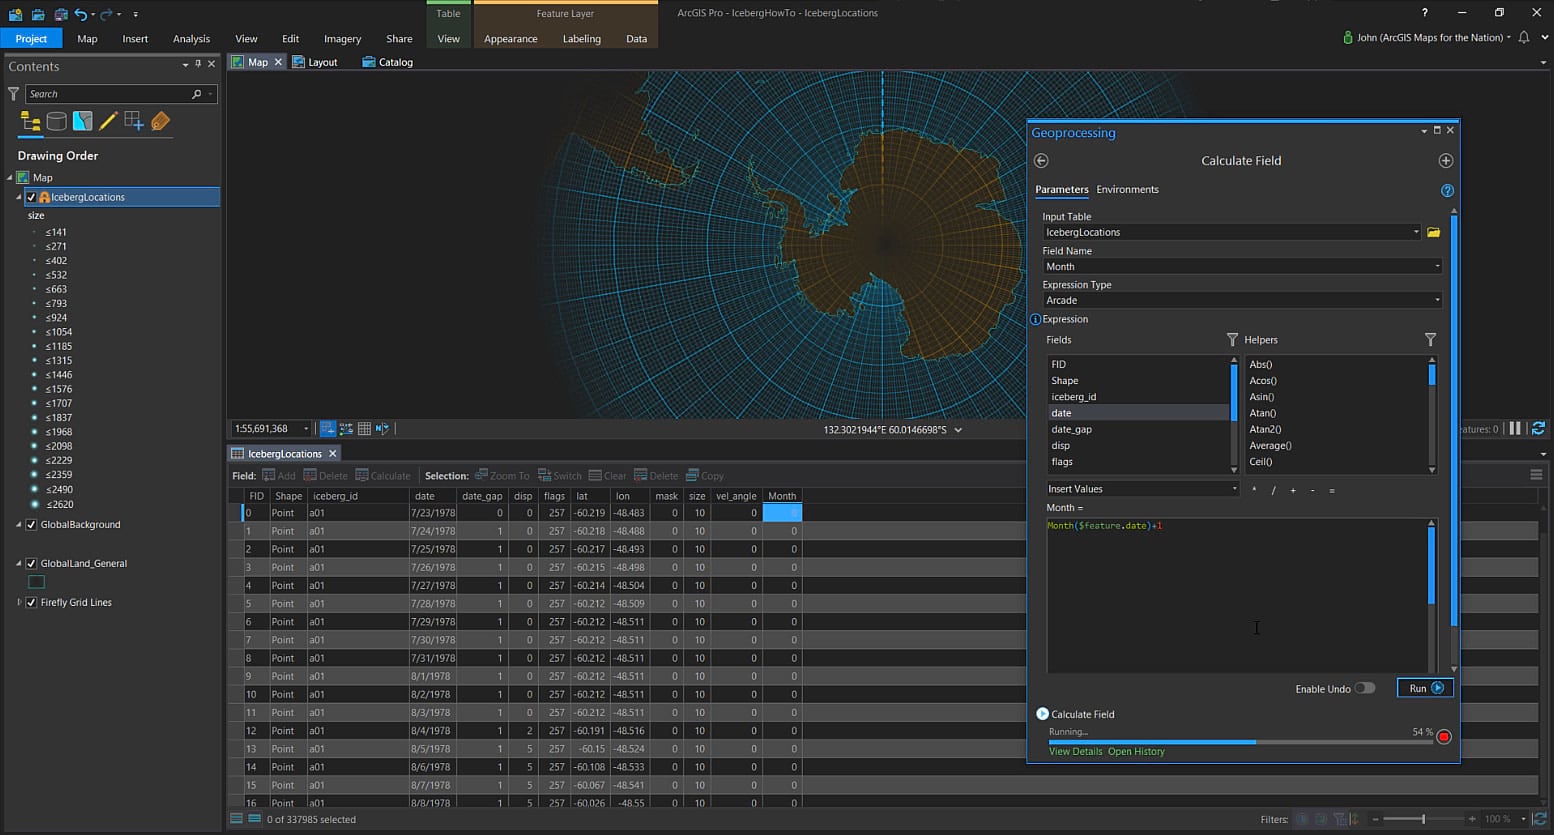
Step 2. Month Attribute
I created a new attribute to hold a month-of-year number and populated (my old friend Field Calculator!) it using an Arcade expression. There are all sorts of date functions available to you to slice and dice your date field into any manner of temporal enumeration. I used the Month function.
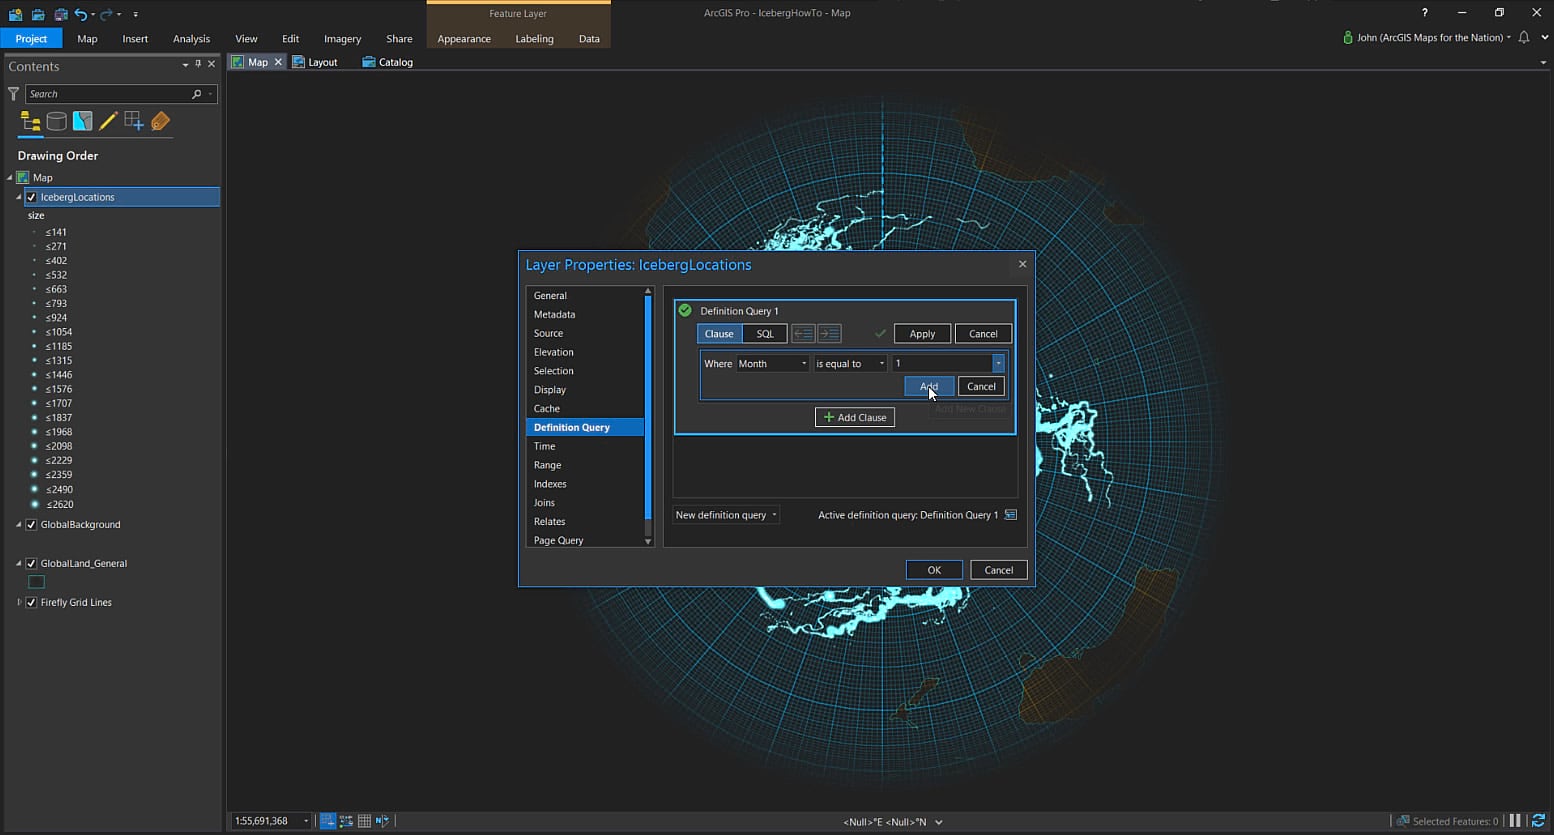
Step 3. Filter by Time
Next, I used a mega-handy Definition Query to filter the iceberg layer by the new month attribute.
If you prefer a finer temporal resolution than the rather choppy 12 frames I made, you could also create a day-of-month attribute and add that to this definition query to make the month cross-section time animation as fine as you like. Does that make sense? I didn’t do it here because I am far too lazy.
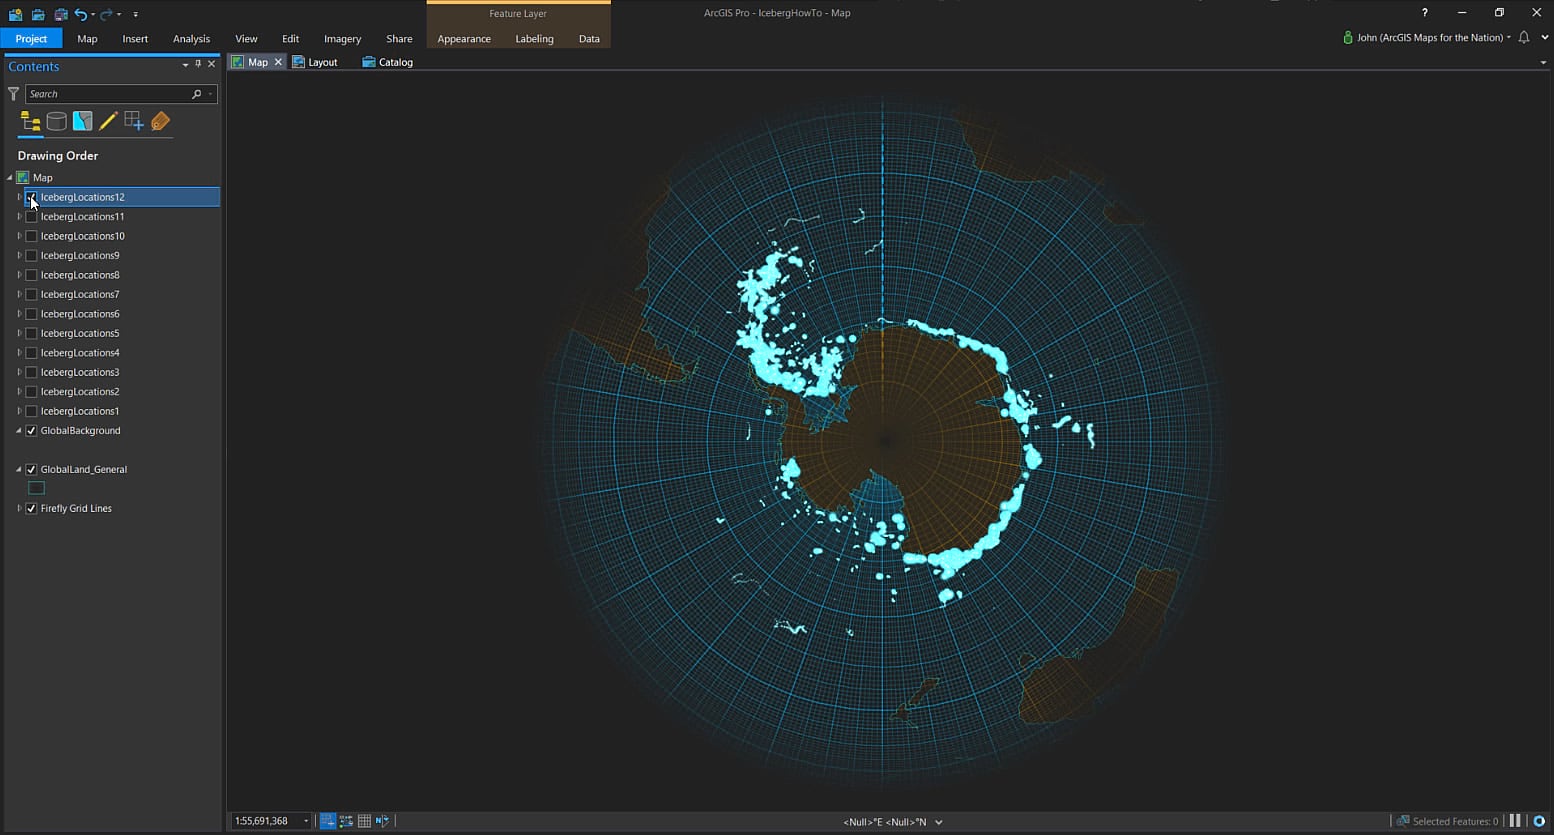
Step 4. Duplicate Layers for Animation Frames
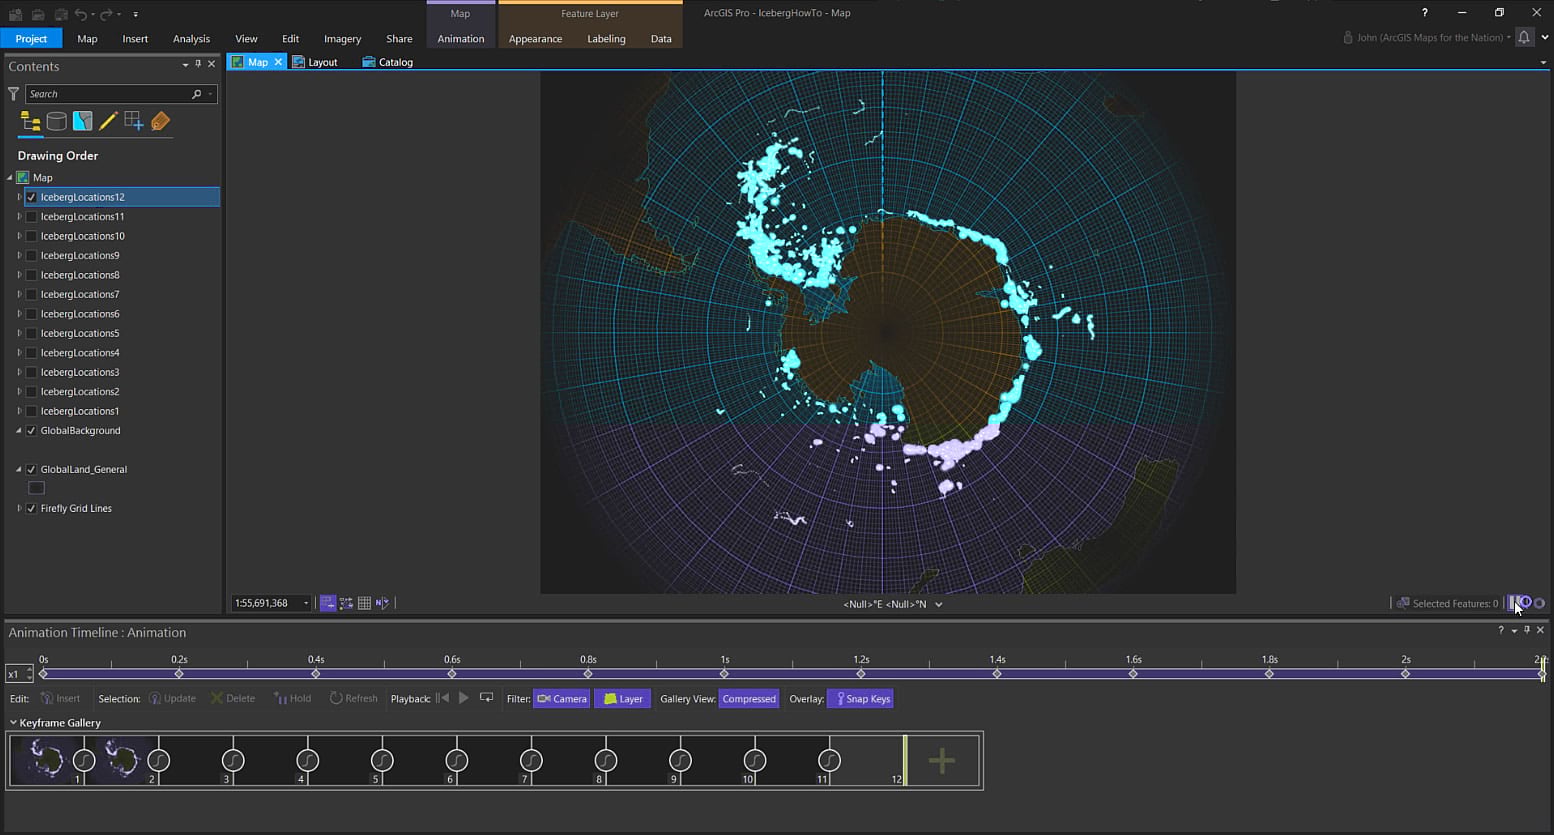
Next I duplicated this time-filtered layer to make 12 layers. I modified the definition query of each so that I had a single layer for each month. These will be used as keyframes in our animation.
Step 5. Animation
Now that we’ve got 12 tidy little month layers all queued up, we can crack open the vast and wondrous capabilities of Animation in ArcGIS Pro…and only use a minute sliver of it. In the View tab I added an animation. Then I sequentially went through and saved an animation keyframe (like an individual image frame within a filmstrip). One for each month.
By the way, this is a big data set, so to speed things up I paused rendering in Pro while I turned layers on/off and saved keyframes. Did you know you could do that? There’s a little play/pause toggle button in the bottom right corner of the map. Handy if you’ve got work to do and don’t need the map to keep up with you.
And then you just crank out the animation into whatever video format or hosted video service you like. I heard the kids are into this Instagram thing. That’s in there too.
So here’s a run-down of the topics we burned through together in this how-to…
- Creating a new attribute
- Using an Arcade expression in the Field Calculator to smoosh date into to a numeric month field
- Filtering big data with a Definition Query
- Duplicating and modifying a layer in a map’s table of contents
- Creating animations! This was the easiest part. Animations in Pro are a blast.
Happy Map Quickening! John

Commenting is not enabled for this article.