Effectively teaching middle schoolers in the age of technology and social media can be tough; students want flashy graphics and immersive experiences that mimic those of their favorite dopamine sources. With that in mind, the ArcGIS Storytelling team, in partnership with the Esri Tutorials team, Esri Education team, and National Geographic Education, took on the challenge of turning lessons into stories with ArcGIS StoryMaps. These stories not only provide background information but visually explain complicated social studies and earth science topics through maps.
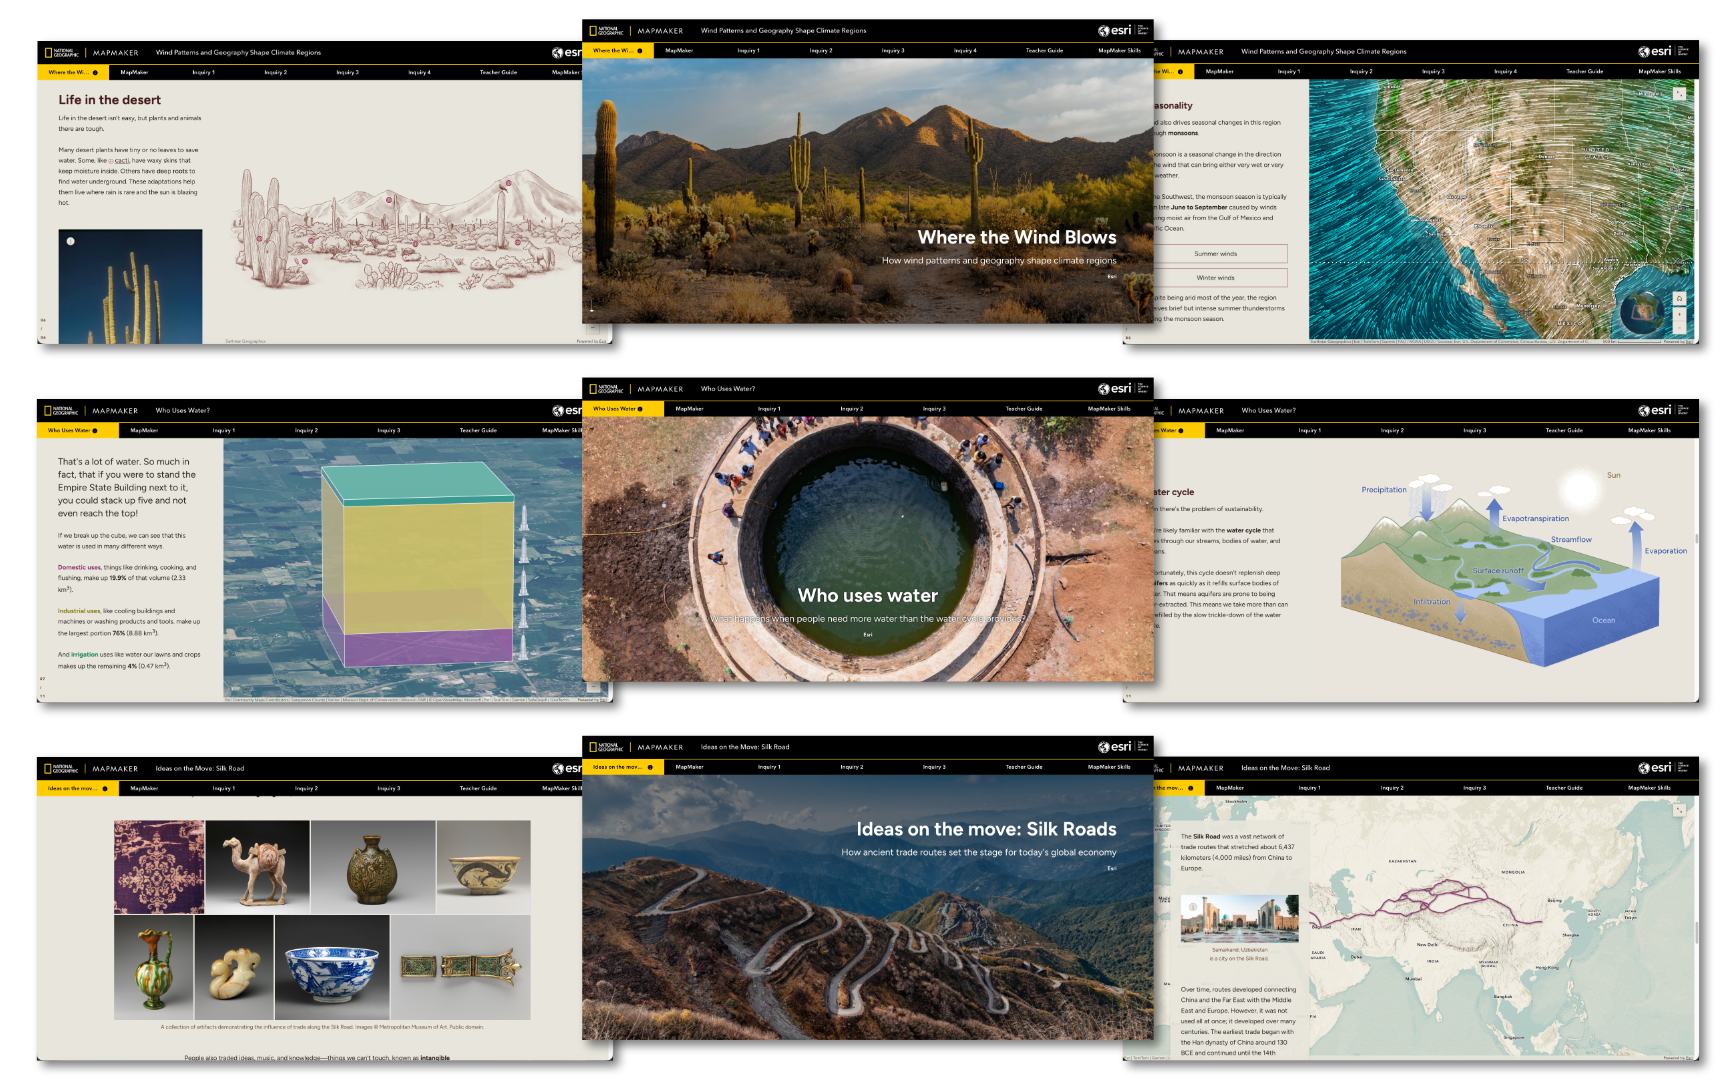
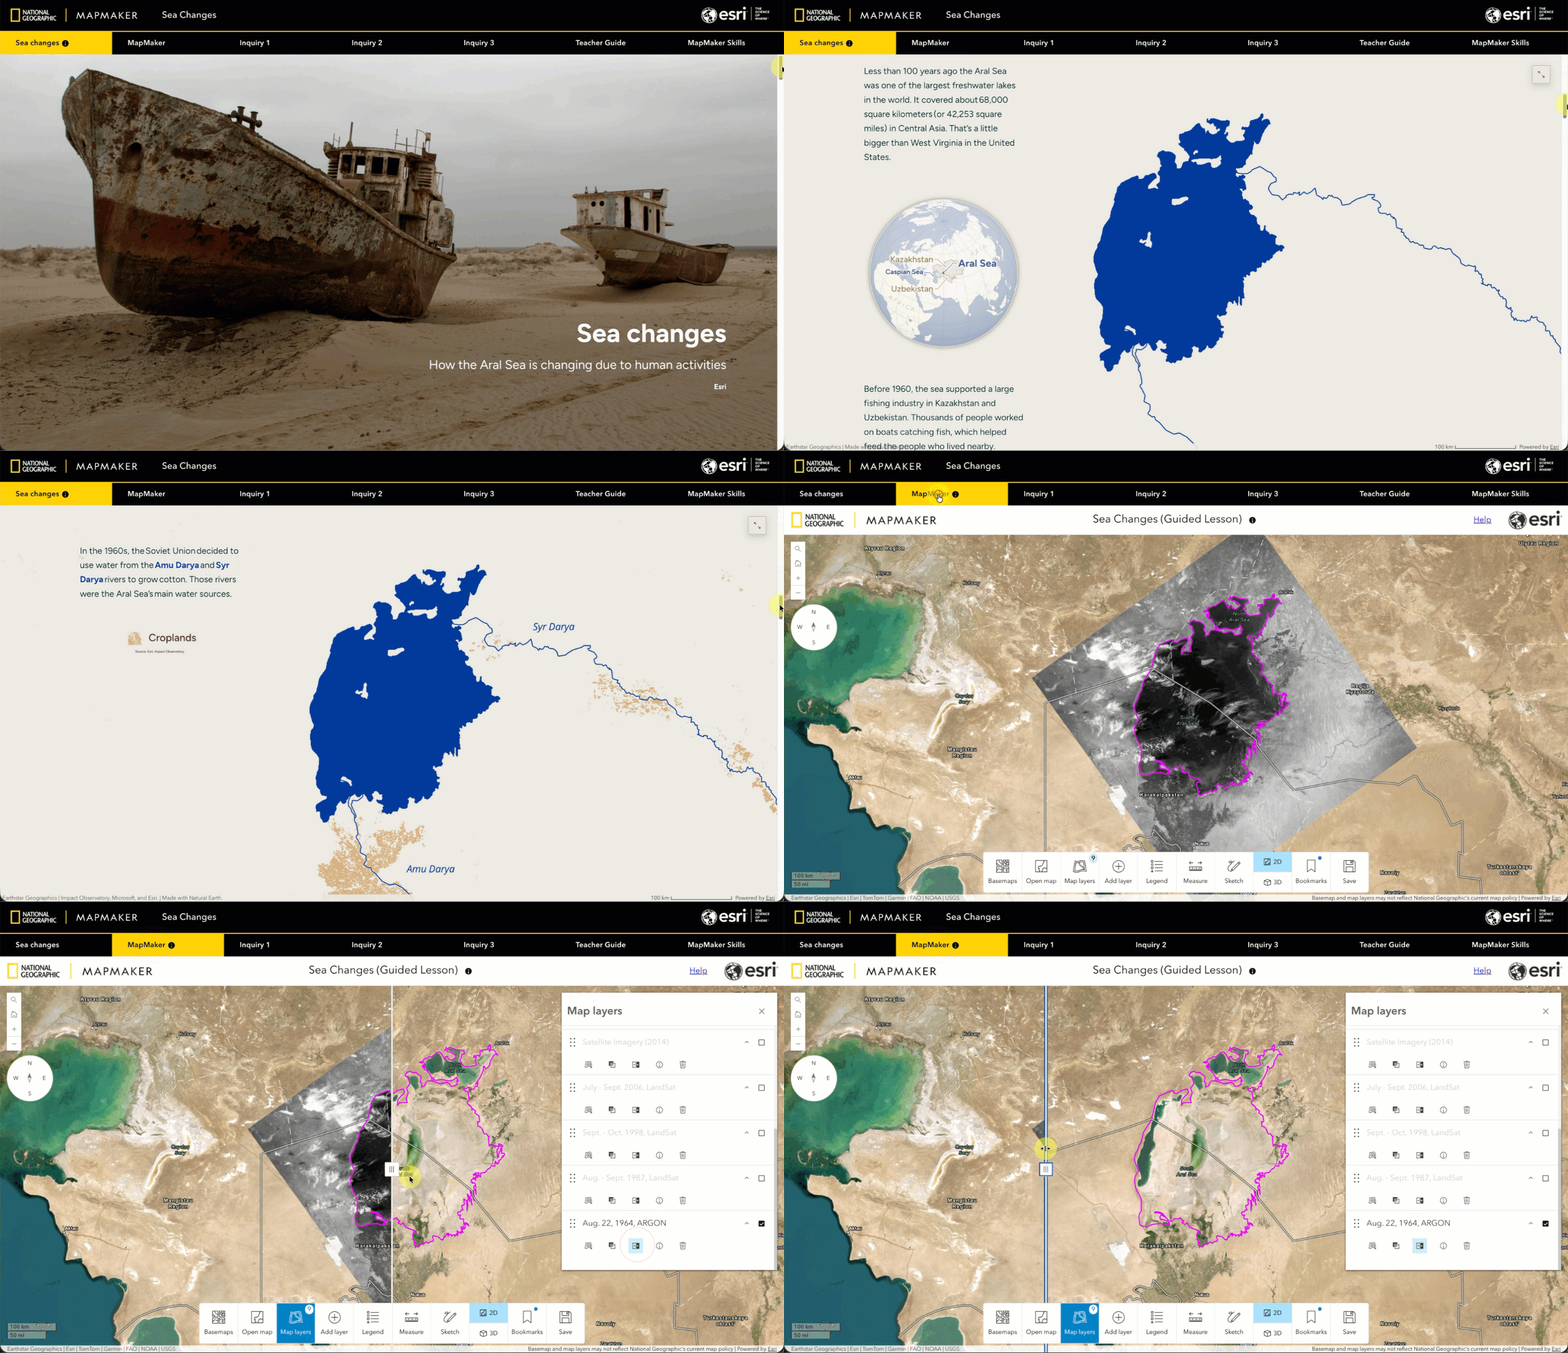
Students first engage with the story then move on to an inquiry-based activity using National Geographic MapMaker. MapMaker is a digital mapping tool, created by the National Geographic Society and Esri, designed for teachers, students, and National Geographic Explorers.
Special Considerations
These stories challenged our team in a variety of ways.
Writing globally, not locally
National Geographic Education wanted students to know two things after reading our stories: 1) geography topics apply to the entire world, not just the United States, and 2) humans are a part of Earth’s processes. We needed to carefully consider which locations we showed, and which human stories we told, to help a global audience see themselves represented.
Adjusting reading level
Writing to an audience of 6-8 graders is very different from writing to an audience of adults; we needed to adjust the way we talked about geography, so that concepts were not overwhelming.
Leaving room for inquiry
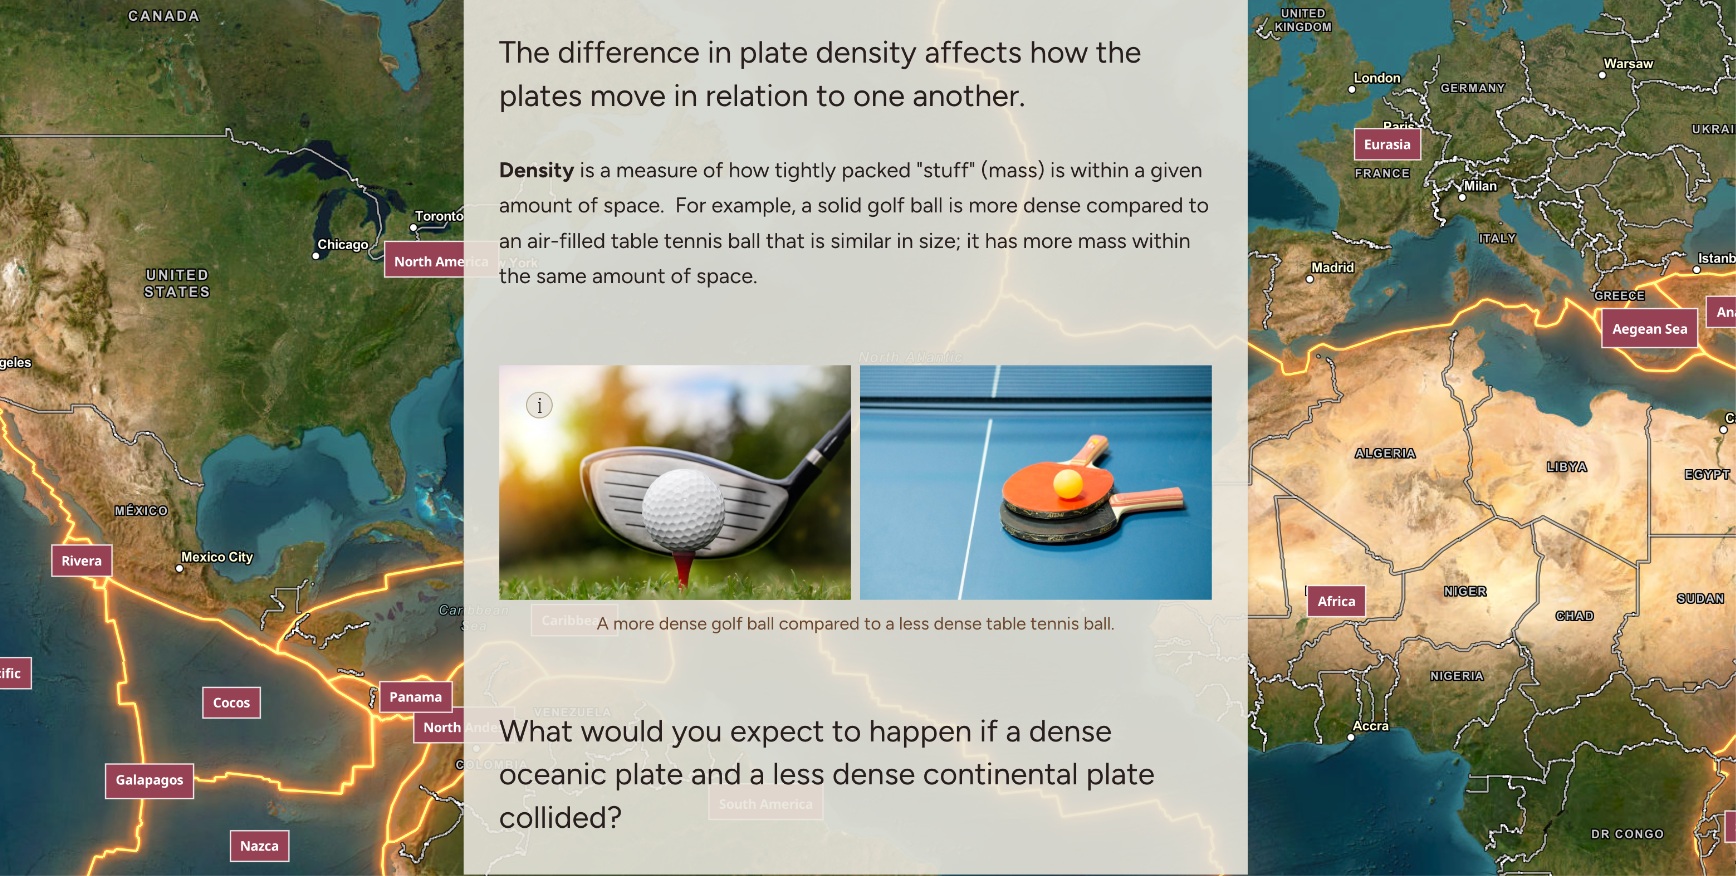
Our stories were meant to explore concepts and map layers students would later manipulate within MapMaker. We needed to familiarize students with the data without giving away all the answers.
Making it applicable
As geospatial storytellers, we often use case studies to explore what we see on maps. These lessons were no exception; we found real world examples that resonated with middle school students, often comparing modern-day examples to historical ones.
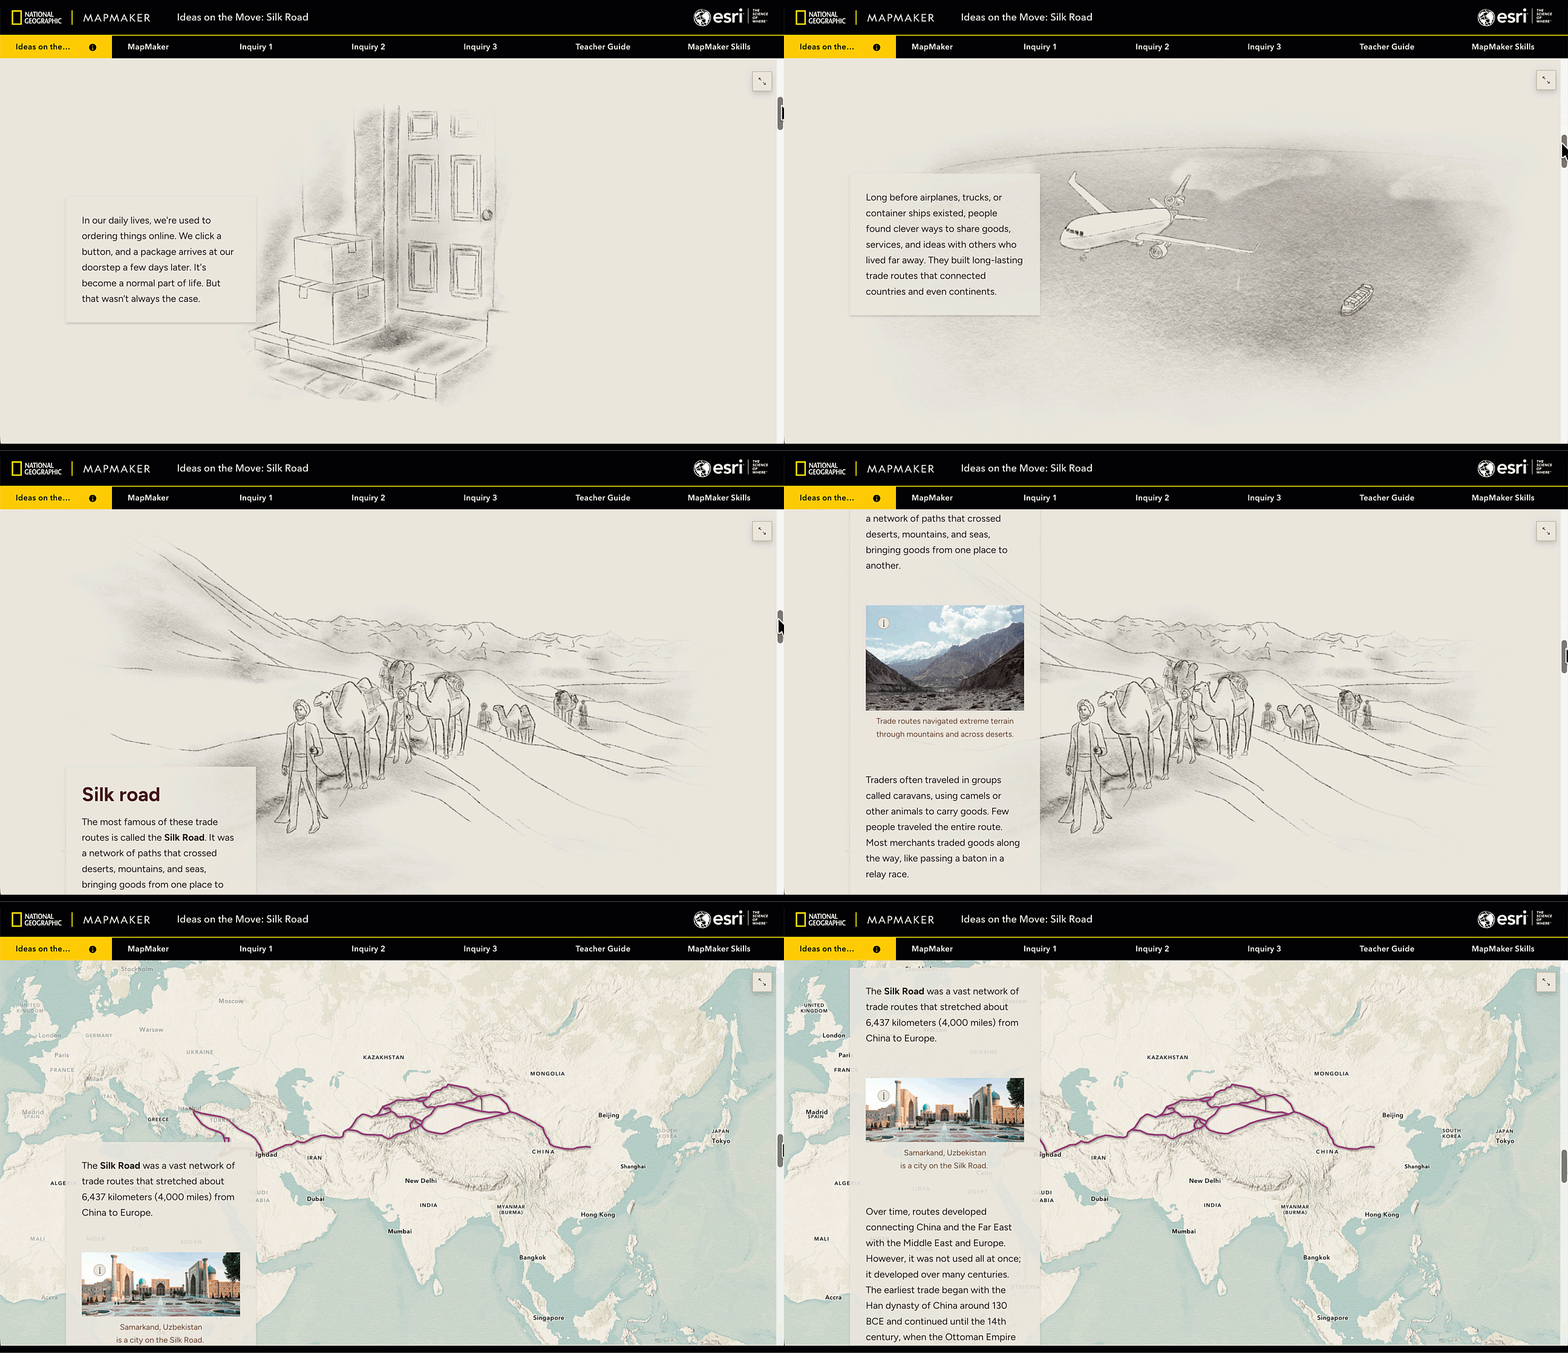
Making room for innovation
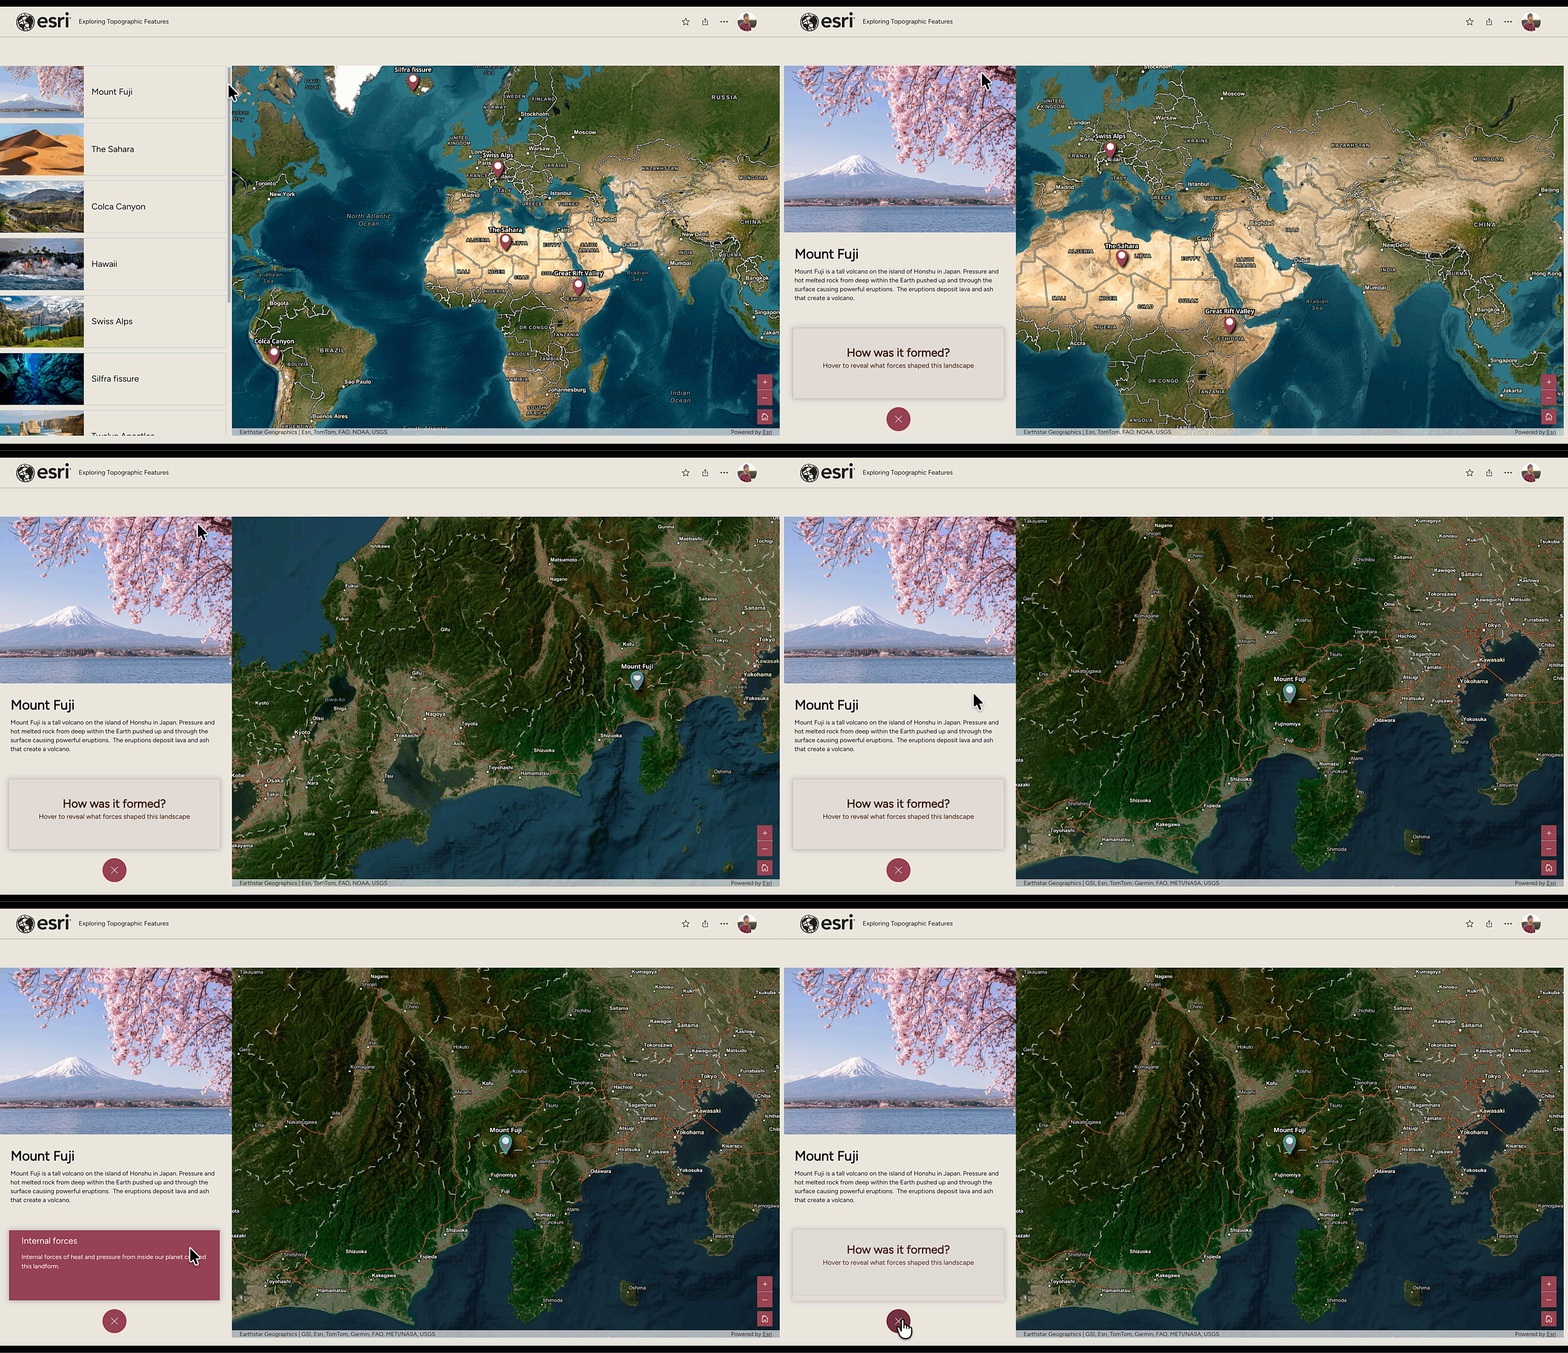
The ArcGIS Storytelling team strives for innovation in all our work. With the knowledge that students crave visuals and interactivity, we sought out unique storytelling opportunities as much as possible. We also incorporated other Esri products and features.
Living Atlas
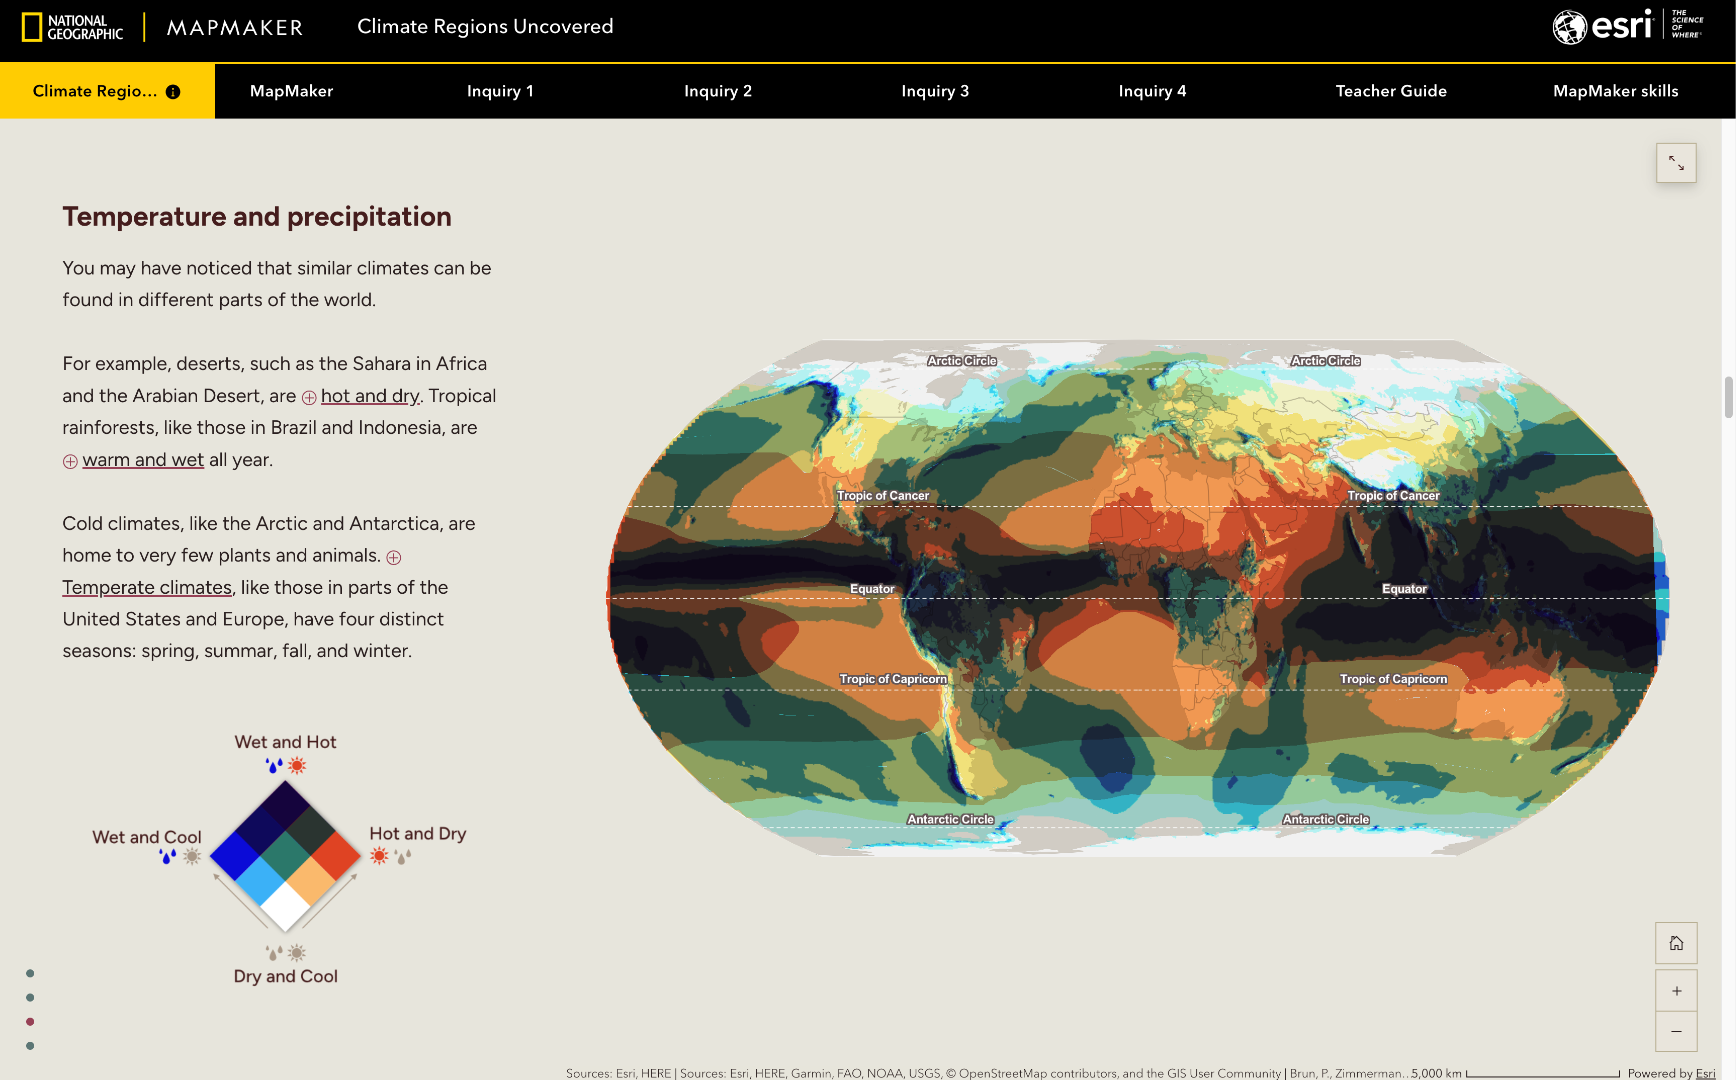
Living Atlas provided nearly all the data we needed for our storytelling. Its wealth of authoritative datasets meant we could ground our stories in real-world data. It also allowed us to introduce cartography principles not typically required by school standards, such as bivariate maps.
Map viewer animations
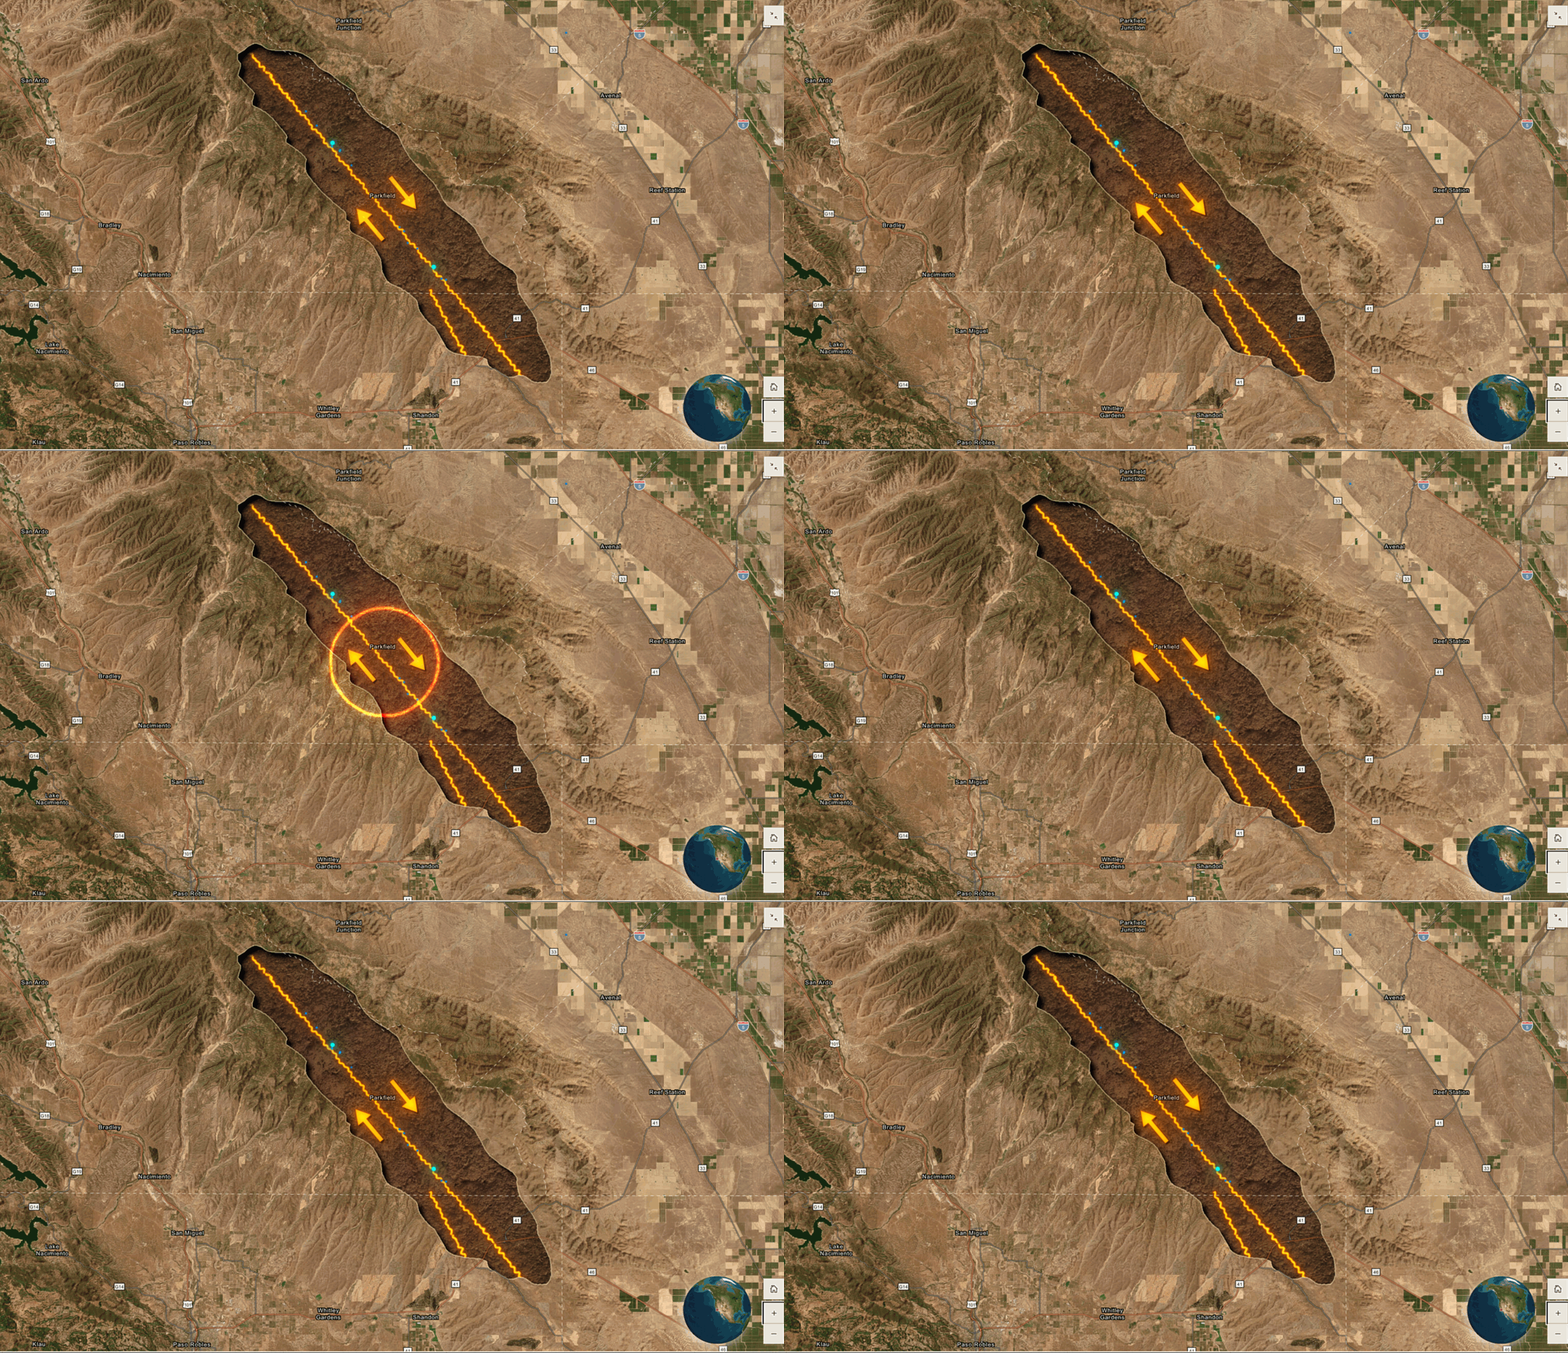
Animation played a big role in illustrating concepts for students. We used animation to draw attention to features and show movement on our maps.
ArcGIS Apps
Teachers requested interactivity within our stories; ArcGIS Dashboards, Experience Builder, and Instant Apps allowed us to create immersive experiences for readers.
Better Together
ArcGIS StoryMaps is a useful educational tool. In conjunction with MapMaker, it becomes a geography powerhouse. And much like the pairing of these two products, the partnership between Esri and National Geographic Education was a perfect match. Putting together the minds of educators, geographers, and storytellers produced high-quality content that will be utilized for years to come.
Explore the Lessons
World Cultures and Geography
Geomythology: When Stories Meet Science
Climate Regions Uncovered
Cultural diffusion: the expansion of Islam
Ideas on the move: Silk Road
Sea Changes
The Dream of the West
Where the city “ends”: stories from the slopes and margins
Where the Wind Blows
Who uses water?
Trading Places
Caribbean Tourism and Gross Domestic Product
Earth Science
Exploring Topographic Features
Where Rivers Run
Making Mountains
Processes that Shape Earth’s Surface
Exploring Earthquakes
In the path of a hurricane
Lay of the Land
Sunlight and Seasons
Wildfires
What causes fresh water shortages?
Exploring the highs and lows of global temperatures
World biomes
Under the Sea
Investigating volcanoes

Article Discussion: