When visualizing data, whether on a chart or a map, we are faced with the choice to present our data individually or in aggregate. Do we show every data point and hope our reader can decipher the meaning, or do we group like values and show a summary statistic? This decision between detail and simplicity can greatly influence how the audience interprets the visualizations that appear in a story.
However, it’s not always an either/or decision. Some methods can bridge the gap in the visualization spectrum and provide benefits from both individual and aggregate techniques. One such method is packed circles.
Packed circles
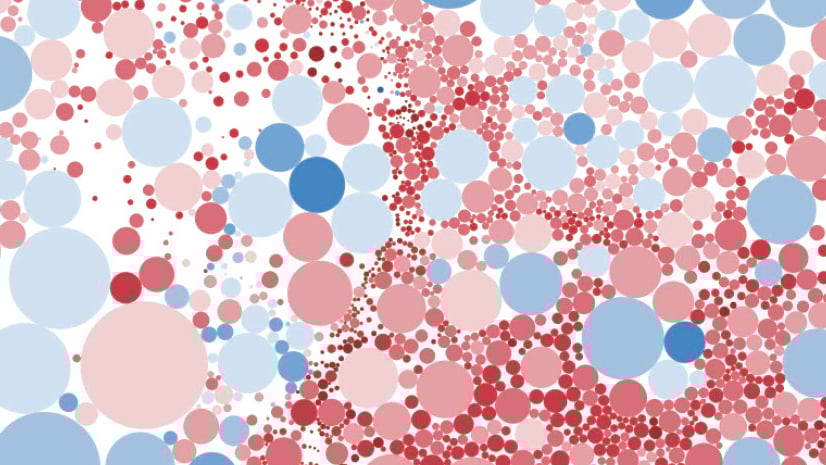
Packed circles, also known as circle packing in the mathematics world, is a data visualization technique where proportional circle symbols are arranged within a larger bounding circle. The member circles represent quantitative values as parts of a whole belonging to a categorical, hierarchical, or geographic group.
The clustered arrangement of the circles within a packed circle can effectively visualize hierarchical membership and visualize the quantitative value of the aggregate while retaining each individual symbol. Since the individual circles are retained, as opposed to being aggregated into a single symbol, they offer some unique advantages when visualizing data.

Connecting with data points
The individual proportional symbols of a packed circle reveal the data points at a more human-readable scale in that each data point equates to one human, bird, ship, event, etc. This trait is incredibly useful from a storytelling perspective. When authoring a story with a protagonist, highlighting the associated data point within a chart or map can be a powerful narrative tool.
In this story about the shipbreaking industry, a single ship from a dataset of nearly 8,000 destined for recycling is used as a narrative vessel to introduce the topic and navigate a data visualization sequence. Throughout this sequence, each individual ship is represented by a proportional symbol within a packed circle. This allows the subject ship to be highlighted through the map choreography sequence. The audience can follow this ship to its final destination, where it is revealed in the imagery.

In this example, packed circles allowed for a strong association between the story’s text and the data points within the visuals. This association helps the audience develop an emotional connection with the data that can result in a more impactful story.
Part of a whole
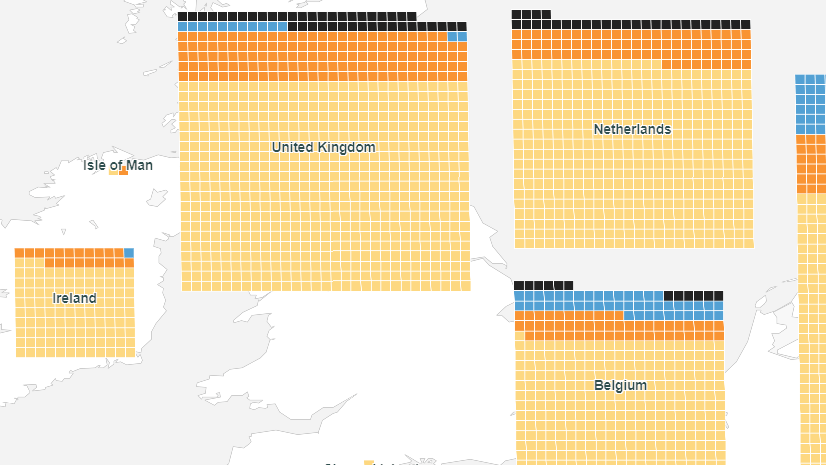
While connecting with individual data points within a data visualization can be a powerful narrative tool, it is also useful in exploratory visualizations. Packed circles preserve the ability to interrogate individual data points while viewing them within the broader context of the group or the whole. This allows for identifying outliers and anomalies within a group and for making comparisons between groups.
Preserving each cluster member also means that they can be used to encoded with additional visual variables. These additional variables can help to reveal the internal composition of each packed circle and reveal connections between many related variables.
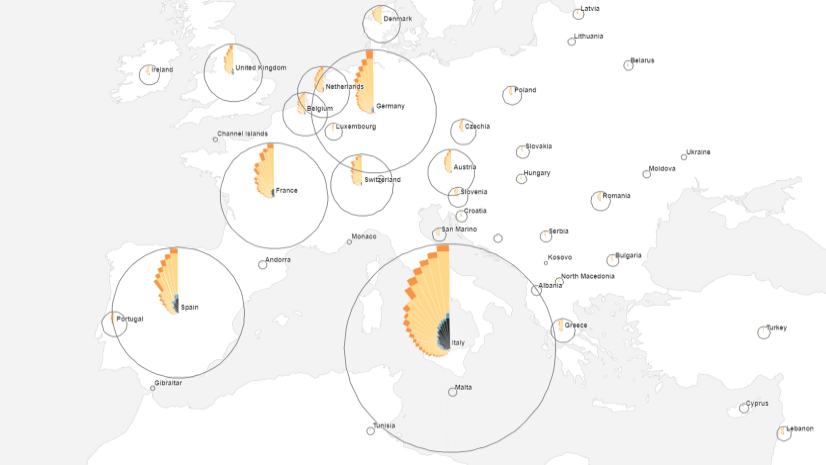
For instance, in the shipbreaking story each proportional symbol represents the gross tonnage of a recycled ship. As the visualization sequence progresses, the color of the symbols is used to encode whether it was recycled using appropriate methods or broken down on tidal beaches.

In the data visualization sequence, the color coding of the ship recycling method is choreographed to preempt the geographic sorting of the packed circles. This has the effect of illustrating that the vast proportion of recycled ships was broken on beaches and that there was a strong geographic pattern of those ships being broken on beaches in South Asia, where environmental and labor regulations are skirted in the name of the bottom line.
Toolbox
If geographic packed circles are just the chart-on-a-map technique you were looking for, then the experimental Python toolbox we created is for you. This tool takes a point dataset and scales each point based on a numerical attribute. These bubbles are then grouped into clusters based on a categorical attribute using a Python circling packing library. The resulting packed circles are then geolocated to the centroid of the member points.
Install & use
We’ve published an ArcGIS Pro project package containing the toolbox, some sample data, and the Python environment to support the toolbox.

To get started, download the ArcGIS Pro project package.
- Inside within the ‘commondata’ folder of the package, locate the ‘arcgispro-py3-MapCirclePackingTool.zip’ folder. This folder holds an ArcGIS Pro conda environment that contains libraries necessary to support the Python toolbox.
- Unzip this env folder to a directory for safekeeping. Ideally, this folder would be extracted to ArcGIS Pro’s env directory ‘C:\Users\[username]\AppData\Local\ESRI\conda\envs\’. If not located in the ArcGIS Pro env directory, it cannot be nested too deeply in a folder directory, or Python will complain about the length of pathnames.
- Open the project and Add a new environment. Navigate to the Package manager within the ArcGIS Pro settings. Select Add an existing environment and point it to the extracted ‘arcgispro-py3-MapCirclePackingTool’ folder.
Running the tool
- Open the tool.
- Select an input point feature layer.
- Specify an output layer name and location for the packed circle features.
- Select a numeric property of the layer. This will be used to scale the area of each circle feature.
- Select a category property of the layer. This will be used to group the features. The average coordinates of all features within a group will determine the centroid of the output packed circle.
- Optionally, select a field to sort how the circles are packed.
- Set the minimum and maximum diameters of the output circles. No individual circle feature will exceed these constraints. Note that the units of these constraints are determined by the input feature layer coordinate system and require some experimentation to achieve the desired results.
- Click Run to execute the tool.
If you create your own packed circles, be sure to share them with us! We love to see your stories with creative data visualizations on @ArcGISStoryMaps.

Article Discussion: