ArcGIS Velocity enables real-time and big data processing and analysis capabilities in ArcGIS Online. It enables users to ingest, visualize, and analyze spatial real-time and big data to gain new insights and take action. Hosted entirely in the cloud, it enables oil and gas companies to explore streaming Internet of Things (IoT) data on maps and dashboards, identify temporal patterns, and extract location-based intelligence. You can start leveraging spatial big data to gain real-time visibility into day-to-day operations and make efficient decisions based on increased situational awareness.
For oil & gas companies, ArcGIS Velocity can help you to implement processes that
- improve the health and safety of people and assets,
- reduce operating costs through remote monitoring,
- increase the efficiency of your production operations, and
- enhance situational awareness.
We recently hosted a webinar on this solution which you can view the recording of on YouTube: ArcGIS Velocity for Oil and Gas.
Below is a summary of what demonstrations were shown in the webinar.
Integrate Any IoT Data Feed into a Map
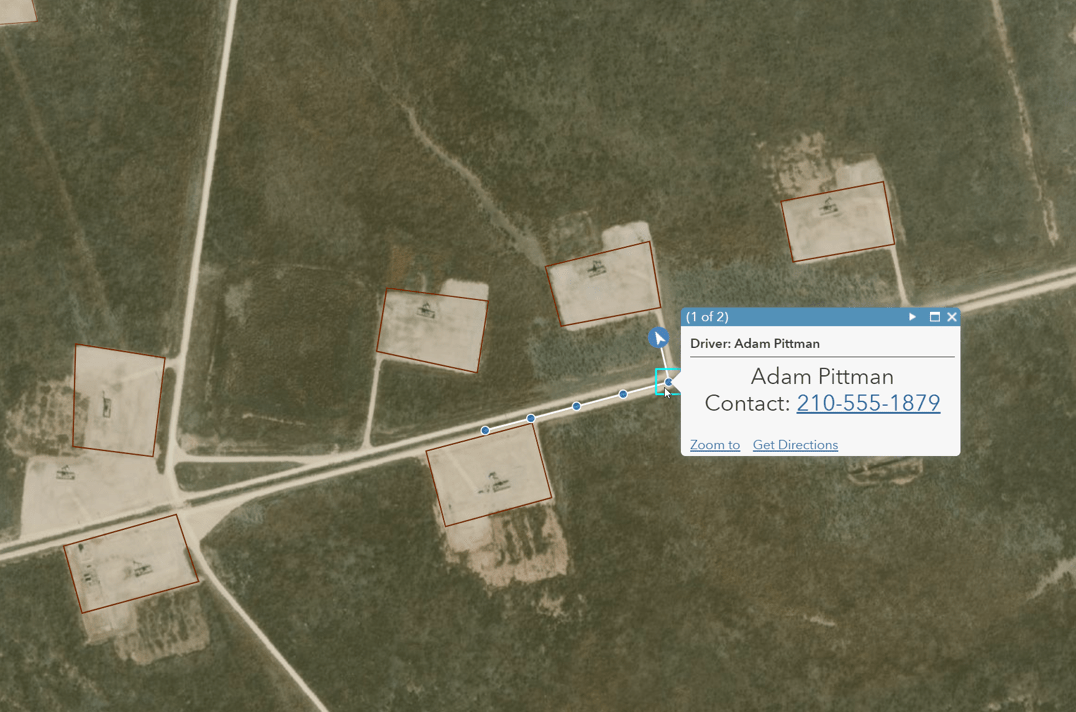
In the first demonstration, we looked at how you can create feeds with ArcGIS Velocity. Feeds are ways for you to consume real-time data sources to be visualized on a map and used in analysis workflows. We connected to a source of data for real-time vehicle locations coming from an automatic vehicle Location (AVL) solution. In addition to showing the vehicle’s location, we can also show historical tracks, the vehicle’s direction, as well as driver information like their name and contact information.
Feeds can be created for numerous types of data including but not limited to vehicles, SCADA, weather, and much more. You can use feeds to make your maps live, integrate many data sources, and get a greater awareness of your operations.
Analyze Worker Driving Patterns in Real-time
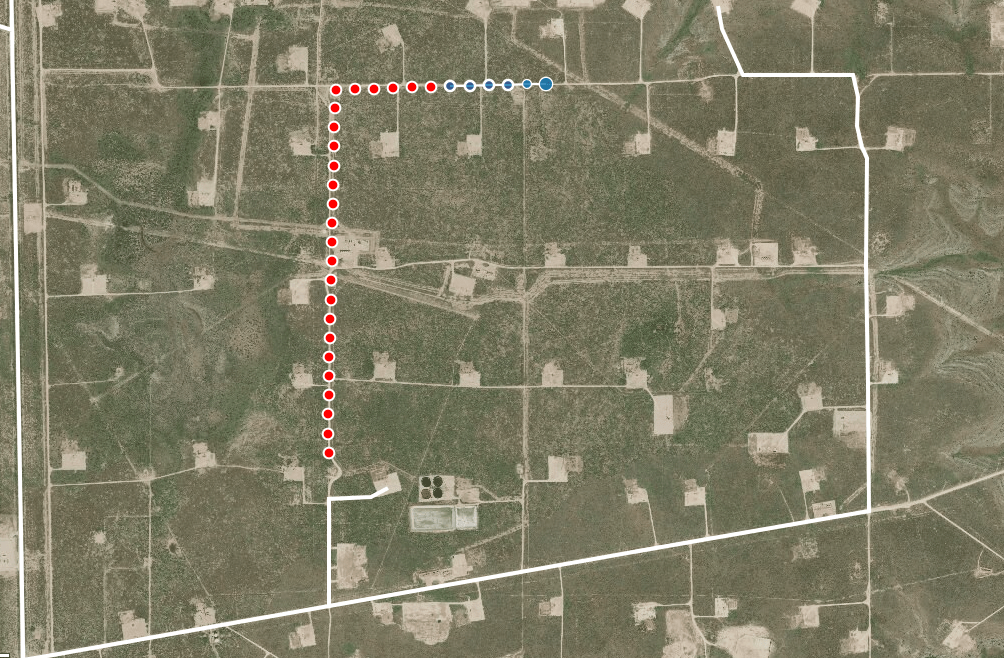
Using real-time analysis, you can gain insight into the efficiency of your operations. In the webinar, we looked at an example using the vehicle GPS feed that we created. We added a layer for each workers’ optimized driving route. We wanted to compare the driver location against their optimized routes to find when they deviated from the optimized routes. The output shows us every location where drivers made route deviations. This same tool can be used to identify high-speed events for health and safety purposes or to identify the nearest employee to correct an issue coming from a SCADA system. Or you could use well pads as geofences to identify where employees are or which ones are currently driving.
Implementing route optimization tools can help you to reduce transportation costs and overall operating expenditures. ArcGIS Velocity can help you to analyze your work patterns to maximize efficiency and identify opportunities for more improvement.
Proactively Respond to Weather for Health and Safety
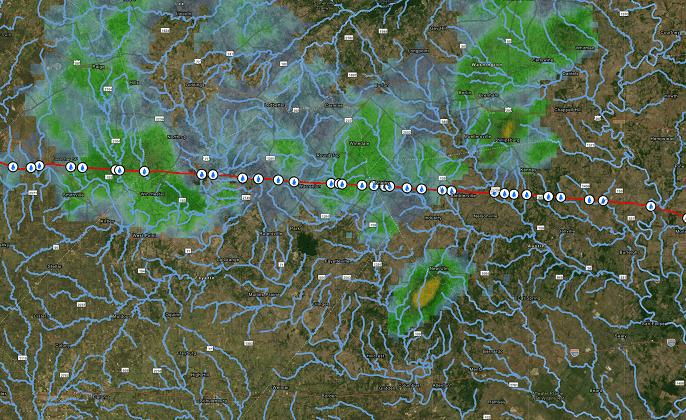
At any point in time, potentially impactful weather events might be occurring near your operations. A heat advisory could be impacting the health and safety of employees. For pipeline operators, a flooding event might be increasing the risk of channel erosion at stream or river crossings. You can use ArcGIS Velocity to identify high-risk channel erosion events so that you can respond proactively by inspecting the stream or river crossing. You can run this analysis every 15 minutes using live weather data to always be aware of the events impacting your operations.
Site Visit Analysis with Vehicle GPS Tracks
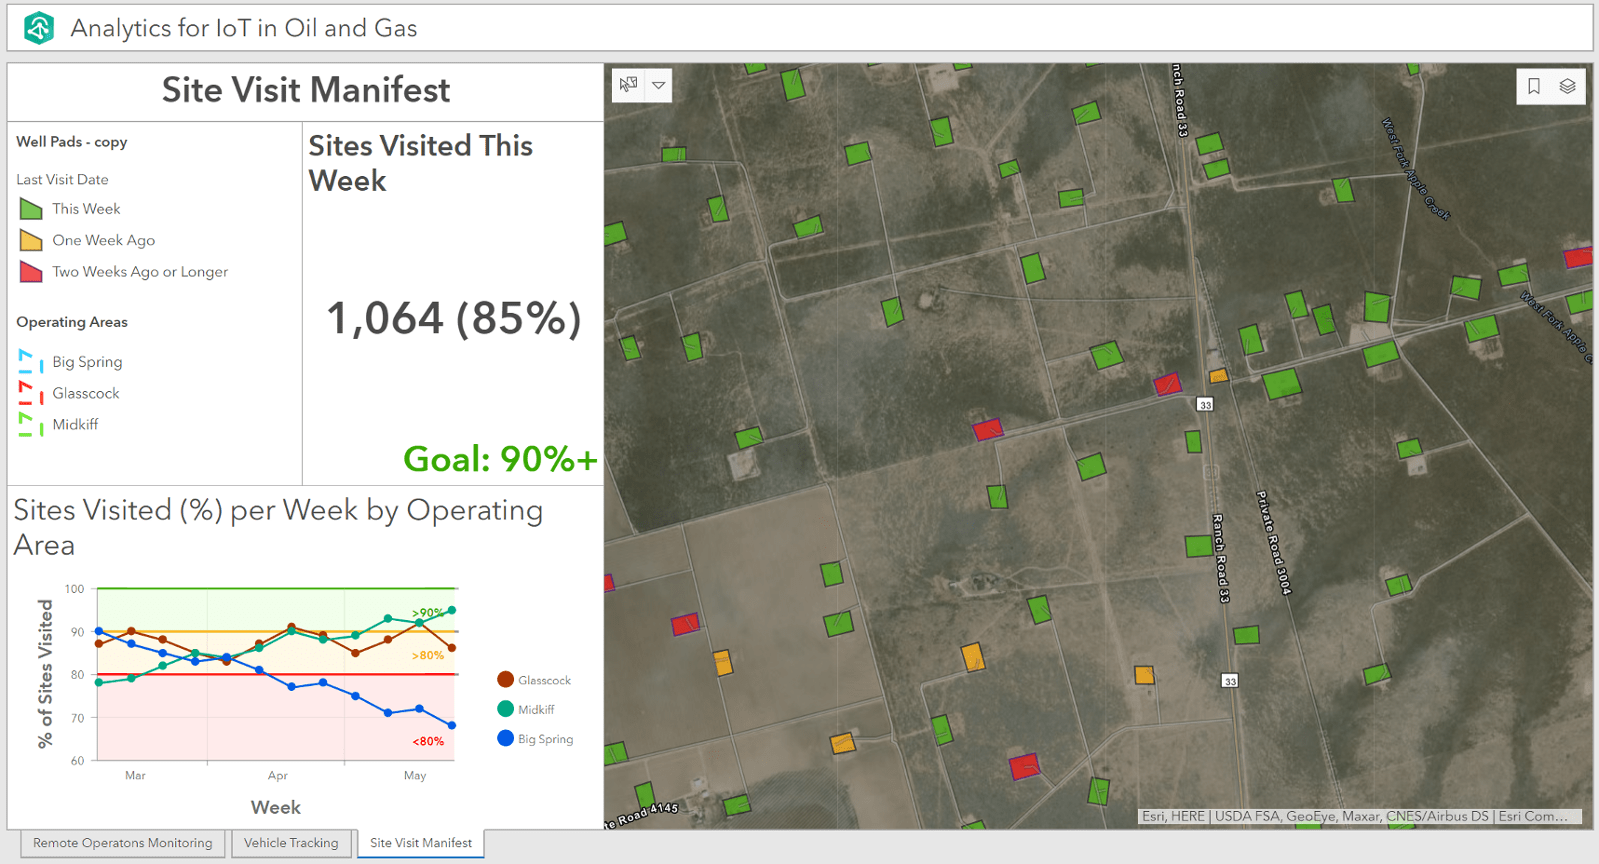
We analyzed millions of historical GPS locations from an AVL solution to identify assets that haven’t been visited in a certain amount of time. Well pads that were visited greater than two weeks ago are symbolized as red indicating they need to be visited. We calculated the % of facilities being visited and compared it against our goal fo visiting 90%+ of our assets every week. This analysis is automated and executed in the cloud every night so that the statistics can be visualized on the dashboard for managers.
You can use this to understand workforce capacity, ensure that work is being conducted as needed, identify areas where more resources are required. Inspecting all facilities is critical for making sure that there are environmentally safe and functioning efficiently. ArcGIS Velocity can help you ensure all facilities are being visited to align with your business objectives.
Article Discussion: