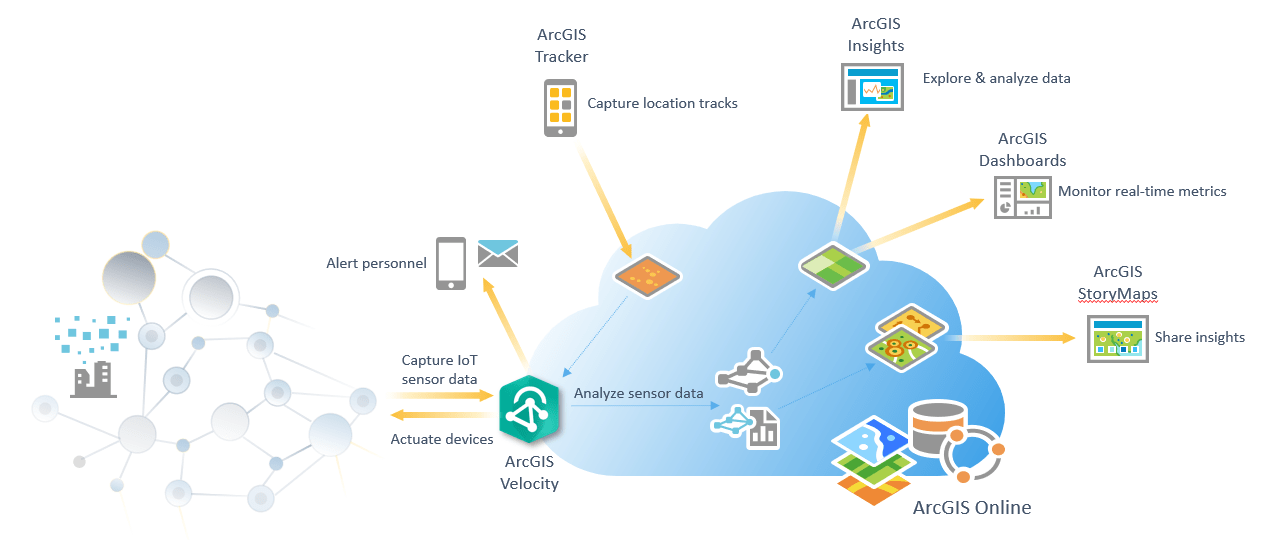
ArcGIS Velocity is a real-time and big data processing and analysis capability of ArcGIS Online. It enables users to ingest, visualize, analyze, store, and act upon massive velocities and volumes of Internet of Things (IoT) sensor data, all in the cloud. Let’s explore how Velocity complements other ArcGIS products and helps you make the most of your IoT data.
Tracker for ArcGIS
Tracker for ArcGIS allows you to capture tracks of field staff, monitor where they are, and analyze where they have been by using their mobile devices as sensors. Use Tracker to get real-time information of mobile users and then perform real-time and big data analytics on the track data using Velocity. You can process, summarize, and gain valuable insights from this movement data.
Operations Dashboard for ArcGIS
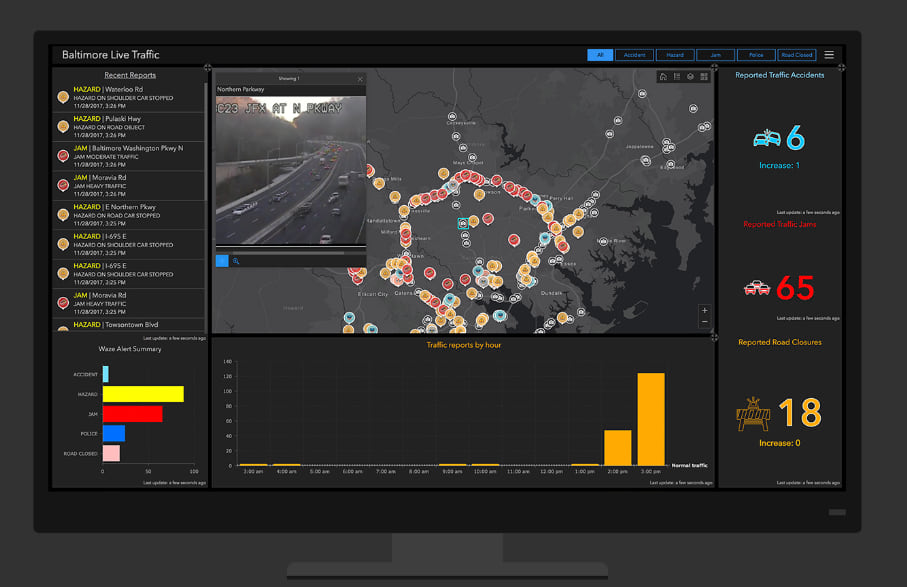
Operations Dashboard is a configurable web app that provides location-aware data visualization and analytics for a real-time operational view of people, services, assets, and events. Velocity allows you to create feeds that can connect to external sources of observational data such as IoT platforms, message brokers, and third-party APIs. In real-time or big data analytics, you can configure outputs that emit data to a variety of different destinations. This includes storing data to a feature layer, sending an email, writing to a cloud store, and pushing to a third-party system for device actuation. When you have connected to your IoT data using Velocity, you can add feeds or output feature layers to Operations Dashboard and easily monitor observations as well as display notifications and alerts when patterns of interest are detected. Easily share your real-time dashboards with key stakeholders, both inside and outside your organization.
ArcGIS Insights
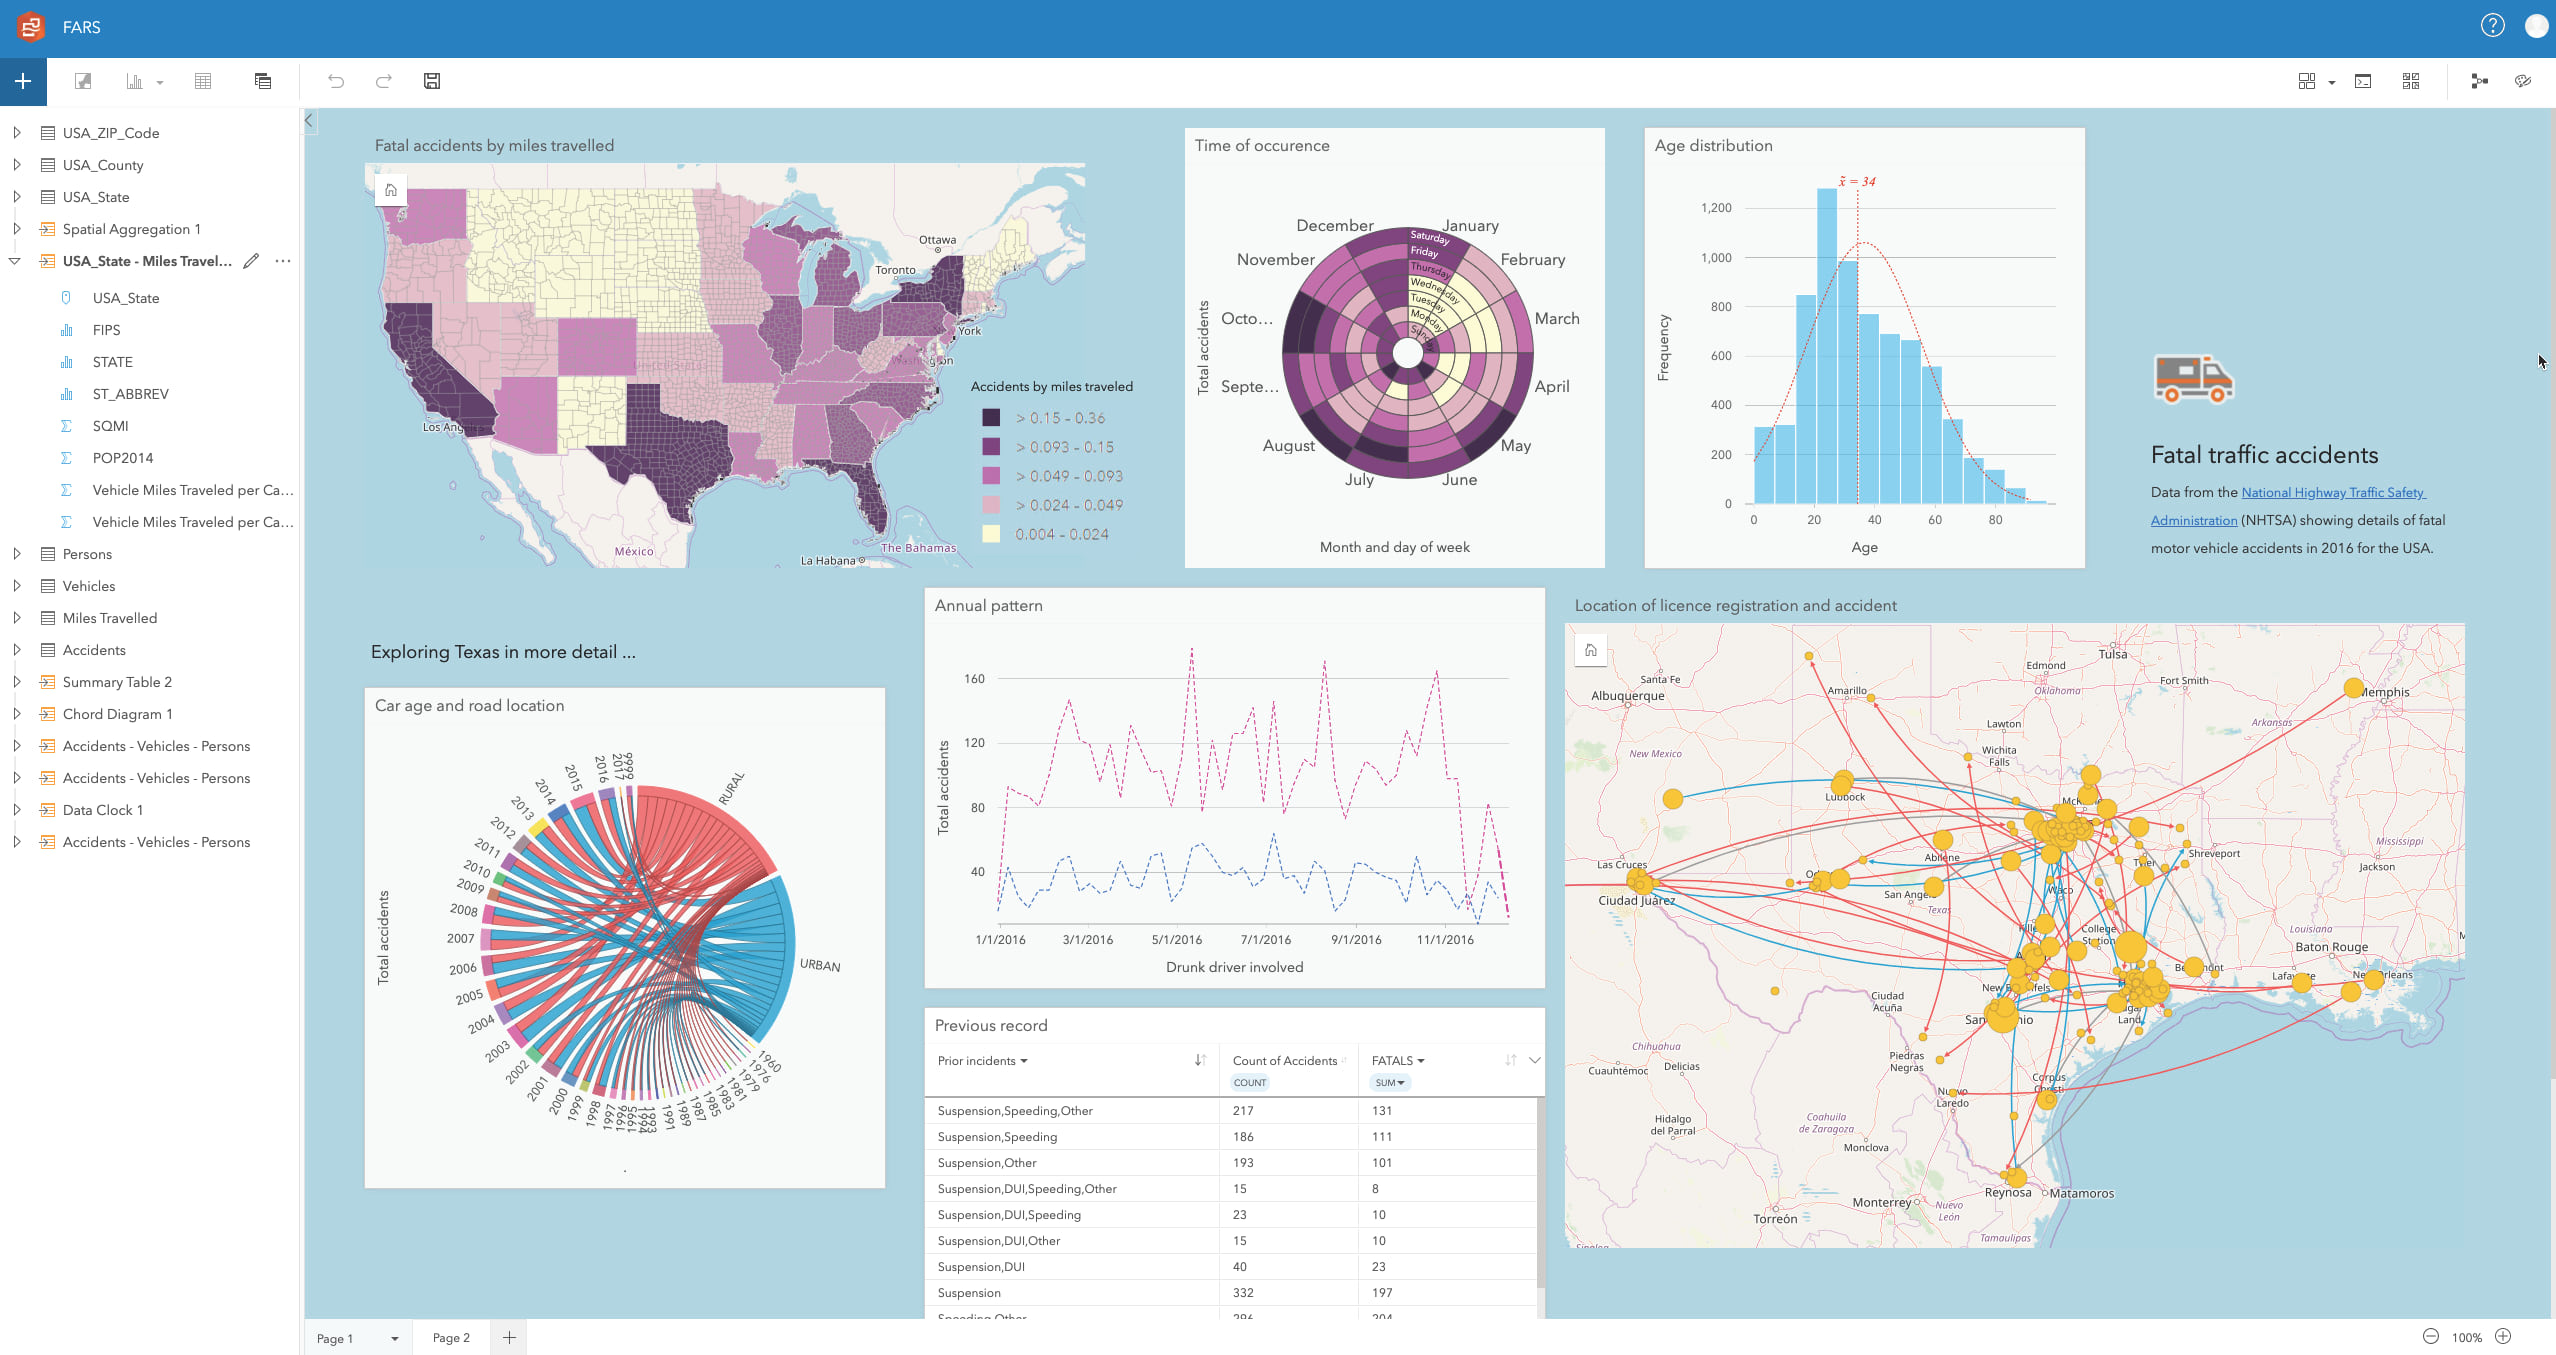
ArcGIS Insights is an analysis software that fuses location analytics with open data science and business intelligence workflows. As you ingest, process, and perform analysis on streaming and stored observation data with Velocity, you can then use the powerful exploratory analytic capabilities of ArcGIS Insights to further explore your historical observations or analytical results.
ArcGIS StoryMaps
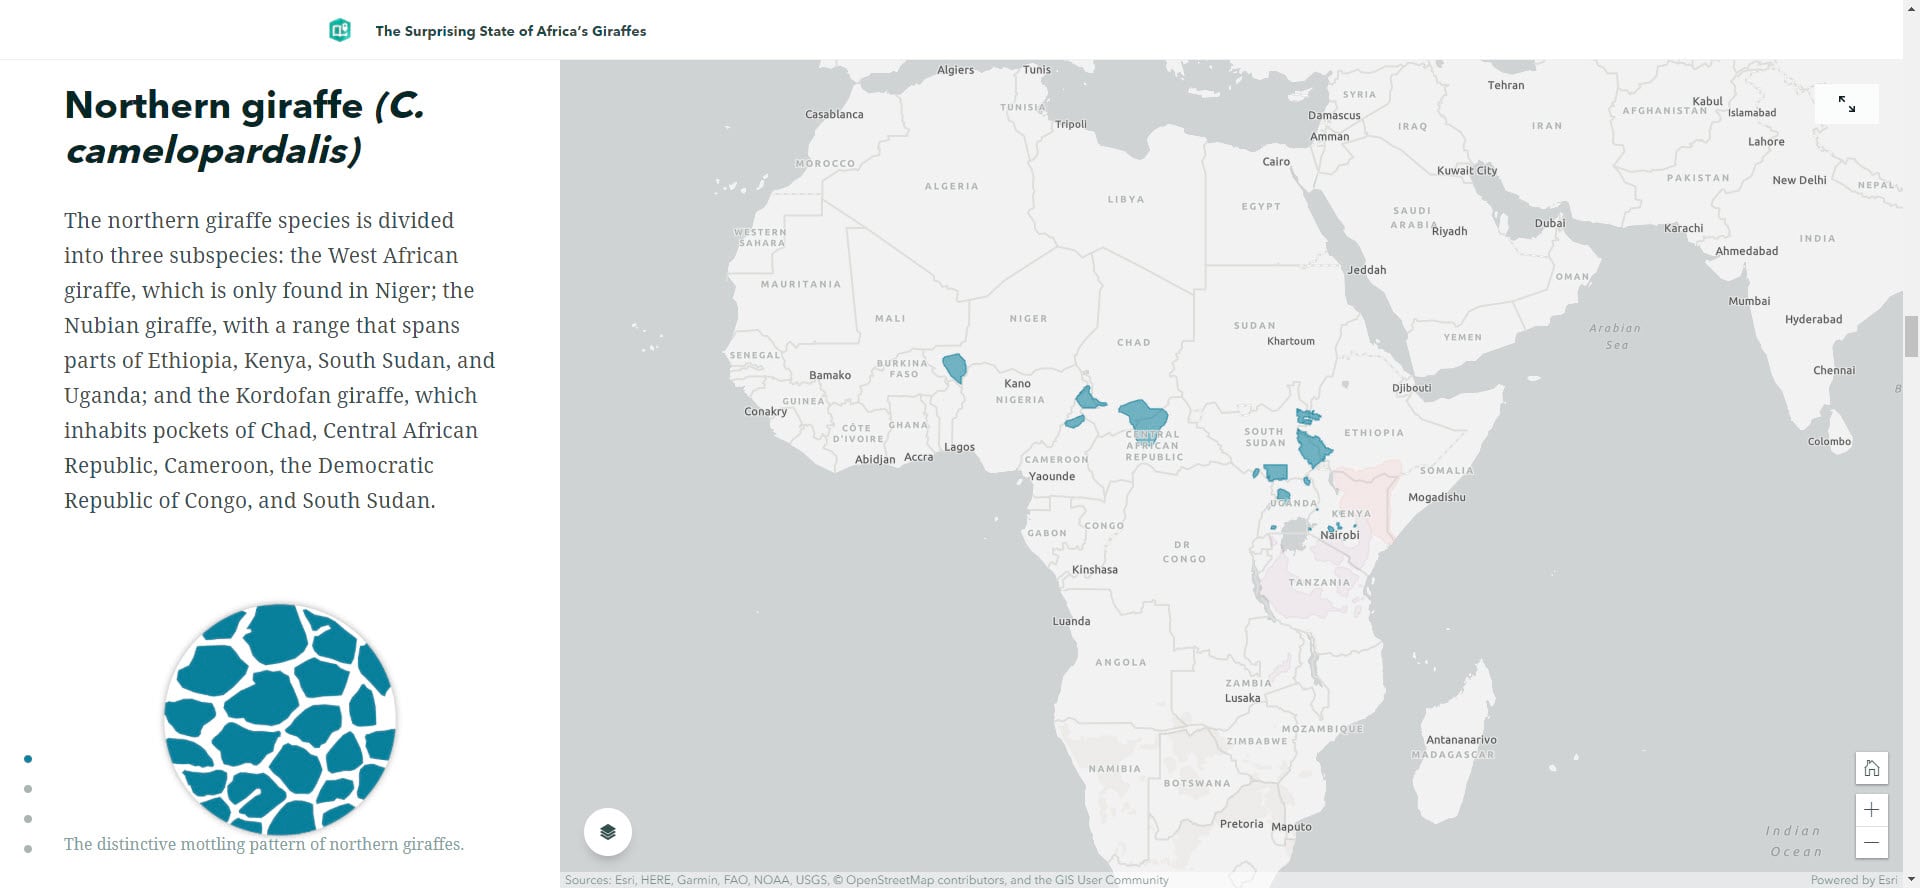
ArcGIS StoryMaps provides simple tools to help you assemble and tell remarkable stories with custom maps that inform and inspire. After performing real-time and big data analytics using Velocity, you can share output information products and results with others inside and outside your organization and include any necessary context to communicate your workflows. Use the story builder to author stories that include maps, narrative text, lists, images, videos, and other media. Feeds, feature layers, or map image layers generated with Velocity can be included in web maps that become part of your story.
Get started with ArcGIS Velocity
To get started, you’ll need a Velocity license for your ArcGIS Online subscription, which includes enough compute and storage capacity for multiple tracking and monitoring use cases. There’s no infrastructure or system configuration required when using Velocity and no limit to the number of users. Any member of your organization with a Creator user type or higher can be granted access to Velocity and immediately begin working with your real-time and big data.
You can learn more about Velocity on our product page. Visit the Resources page to access product videos, quick lessons, documentation, and more.


Commenting is not enabled for this article.