ArcGIS Velocity allows organizations to ingest, visualize, analyze, and act on data from sensors and asset tracks. It also enables processing of high-volume historical data to gain insights into patterns, trends, and anomalies. Remote monitoring of assets, predictive maintenance, and process optimization are a few of the benefits you can gain from your sensor and IoT (Internet of Things) data using Velocity.
ArcGIS Velocity is updated regularly, below are several highlights of the June 2022 release:
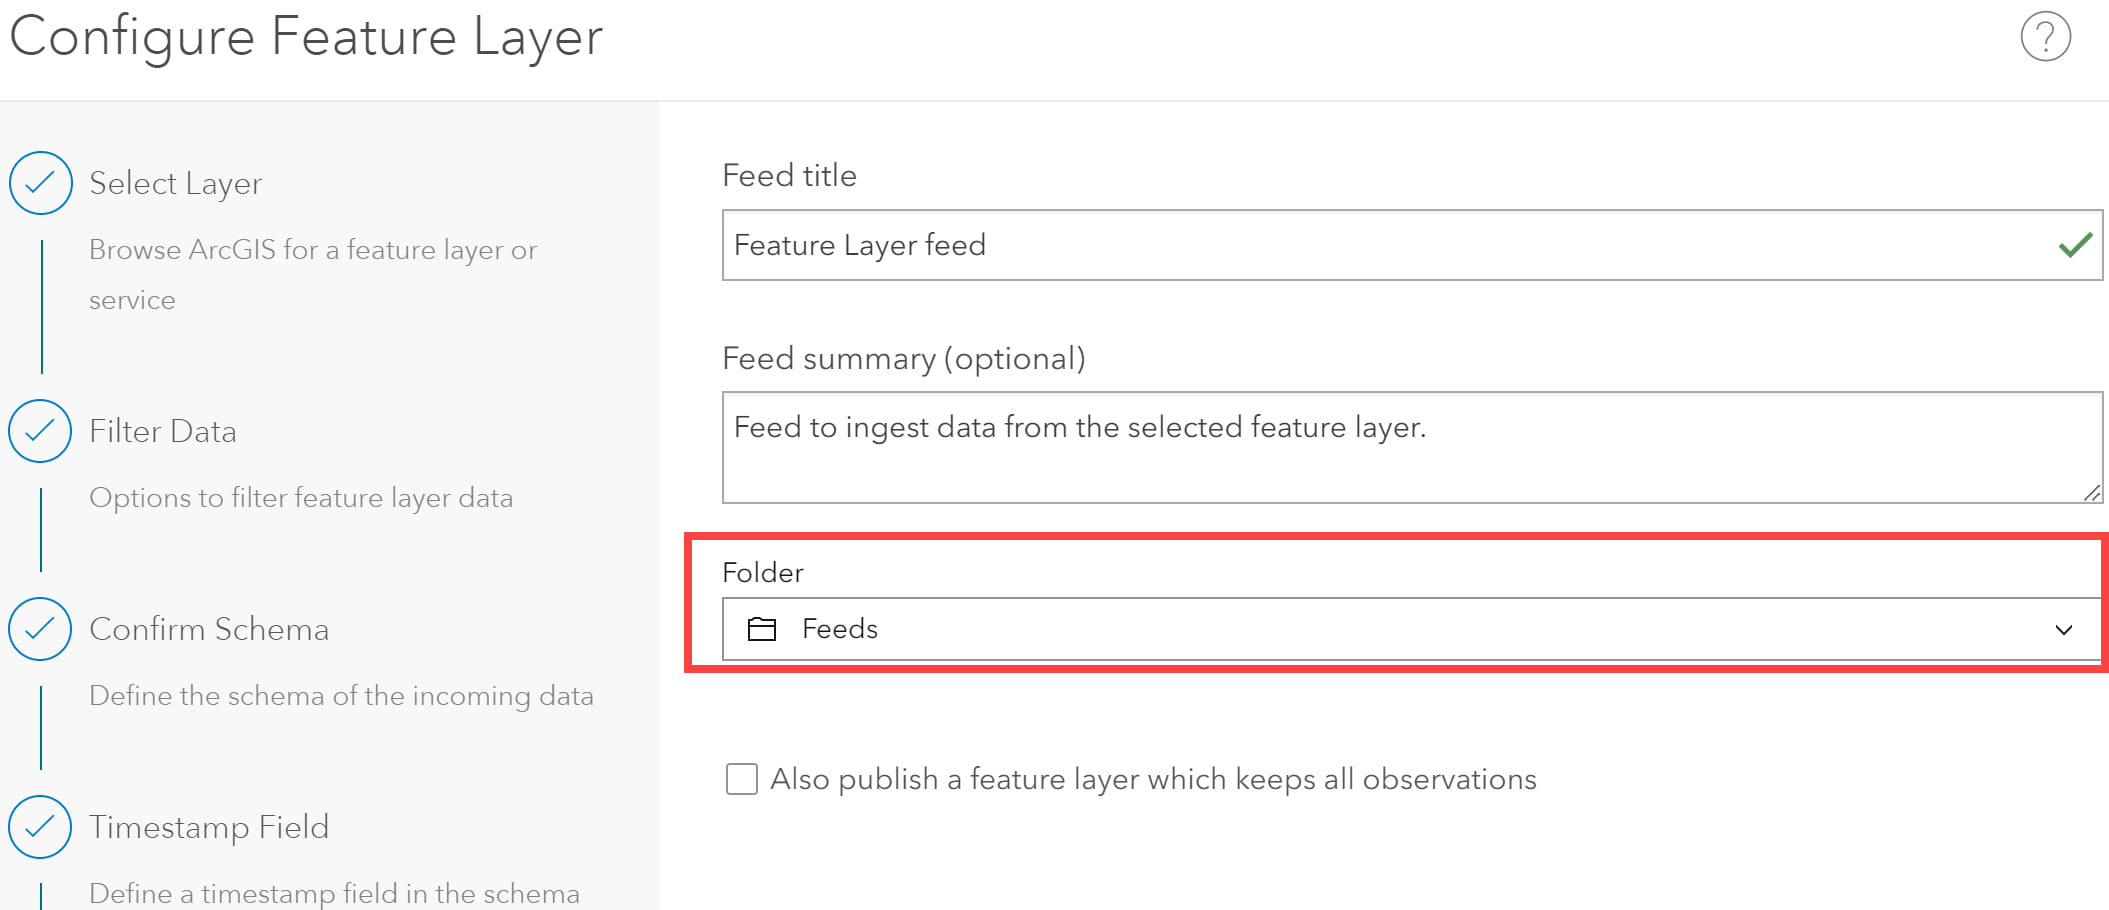
- Data management and visualization – You can now choose a folder in your ArcGIS Online organization to save your new feeds, real-time analytics, and big data analytics.
- Feeds, data sources, and outputs – The Kafka feed authentication options now support SASL/SCRAM and the Kafka output now includes support for SASL PLAIN (optionally with SSL) and SASL/SCRAM.
- Analytics – The FromJSON function in ArcGIS Arcade has been added to ArcGIS Velocity to enable parsing complex JSON data into separate data attributes.
- General – New and enhanced support for several API methods on Velocity hosted spatiotemporal feature layers including Query Top Features and Query Date Bins.
Now, let’s take a deeper dive into each of these new capabilities and enhancements!
Data management and visualization
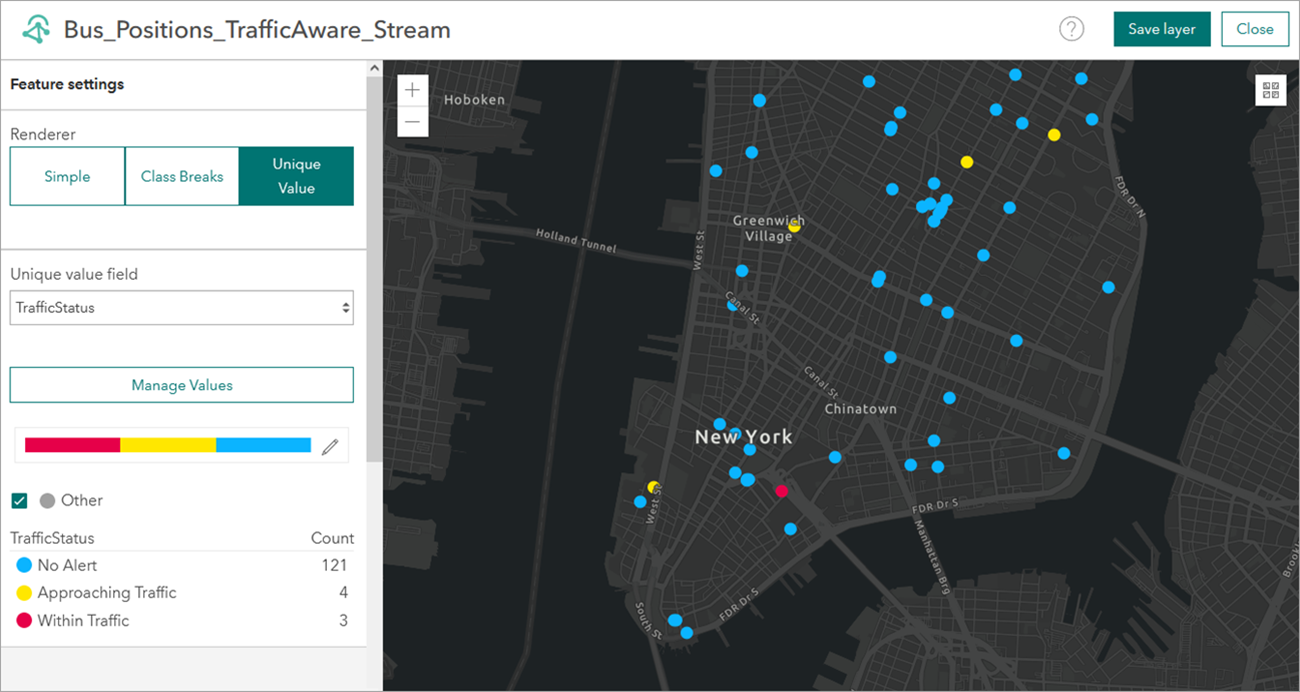
In the previous release, a new experience was introduced for defining the symbology of your output stream layers using different rendering options. Now, feeds provide the same capability, specifically allowing you to define the symbology using simple, class breaks, and unique value rendering.

Additionally, Feature Layer outputs in real-time and big data analytics can now be configured to write data to existing ArcGIS Online hosted feature layers. In previous releases, users could only create a new layer at run-time. Note that when writing to an existing hosted feature layer, including to a spatiotemporal hosted feature layer, the schema has to match the destination layer.
Finally, we added the ability to specify a folder in your ArcGIS Online organization to save your new feeds, real-time analytics, and big data analytics. This makes it easier to manage your real-time and big data content.

Feeds, data sources, and outputs
In this release, the Kafka feed and Kafka output’s authentication options were enhanced to support SASL/SCRAM on both and SASL PLAIN (optionally with SSL) on the output. This broadens the ability to connect to customers’ messaging systems and IoT cloud-hosted brokers such as Amazon Managed Services Kafka (MSK).
Other authentication enhancements were made for the HTTP output and the HTTP Poller source, which were broadened to support OAuth 2.0. This increases flexibility for connecting to external vendors and API’s.
Analytics
On the analytics front, several new capabilities and enhancements were introduced in this release. First, new support for the FromJSON function in ArcGIS Arcade enables parsing complex JSON data. This makes it easier for users to manipulate data schemas when incoming data has a JSON structure that cannot be easily flattened into feature layer records.
Previously, dynamic geofencing capabilities were officially released in March. In this release, we have improved dynamic geofencing validation and messaging. For example, validation has been expanded to clarify issues when the dynamic geofencing expiration time window has been set in excess of the limit; this assists with usability and configuring successful workflows.
General
In this release, there’s new support for several API methods including Query Top Features and Query Date Bins in ArcGIS Velocity hosted spatiotemporal feature layers. Specifically, the Query Top Features method allows you to return a feature set based on the top features by order within a group. This is useful when displaying statistical summaries of data in a dashboard such as the top five counties by population in a state. Furthermore, the Query Date Bins method generates summaries of records based on a date field and grouped into bins such as day, month, or year. This allows client apps to easily render histogram charts that show temporal trends.
Additionally, support for the service-level lastEditDate was added, so users or map clients can now check the most recent date that any record was changed. These changes could be the result of users editing or Velocity updating or adding a record during automated ingestion. The lastEditDate information is leveraged by ArcGIS client apps to avoid querying a layer excessively if there has been no updates.
And more…
For a complete list of enhancements and everything new, check out the what’s new topic in the documentation. If you have ideas/enhancements/feature requests for the product, be sure to post them on the ArcGIS Velocity Ideas board in the Esri Community.
To learn more about ArcGIS Velocity, browse the available resources to access product videos, quick lessons, documentation, and more!

Article Discussion: