Are your desktops properly resourced? Have you ever wondered how adding resources might improve your users’ ability to work productivity? Well, we have some test results to show you.
Infrastructure teams naturally look at utilization, capacity, and configuration. Editors experience those choices differently: as a delay while a map redraws, a pause while a tool completes, or a workflow that takes several extra minutes. Repeated across a day and across a team, small delays add up to reduced productivity- which can result in significant operational costs.
We conducted a desktop editing test study to measure the impact of desktop hardware on user experience and their ability to work efficiently.
Hardware decisions should begin with the workflows they need to support. In our tests, properly resourcing ArcGIS Pro desktops for our editing workflows produced measurably improved system performance and user productivity.
The practical lesson is not to default to buying the largest machine. Rather, identify where resources are constrained through testing your own workflows and observing whether additional hardware investment produces a positive ROI when factoring in productivity gains. Let’s dig into the test results to get into the details.
Hardware choices are part of the user experience
This relationship matters especially in virtualized environments. When a GPU is unavailable, ArcGIS Pro may use CPU emulation for graphics capabilities, which can produce suboptimal performance in workflows that depend on graphics processing. CPU requirements also vary by workload, making telemetry essential for identifying bottlenecks rather than relying on a generic configuration.
The hardware choices you make directly affect the user experience and should be evaluated (in large part) by how much they improve or reduce your users’ ability to complete their important business workflows.
No guessing – let’s look at the results
Hardware planning often begins with historical sizing, a default recommendation, or the belief that a larger configuration is automatically safer. Those approaches may establish a starting point, but there is no one-size-fits all – it is going to depend on your specific workflows and requirements.
In the test study we used a systematic approach:
- Chose one aspect of the system configuration to test at a time, holding everything else constant:
- vCPU impact on the ArcGIS Pro desktop instances (4vCPU versus 8vCPU)
- GPU impact on the ArcGIS Pro desktop instances (with dedicated GPU versus without)
- Tested the same workflows under identical environment conditions for each configuration
- Captured and collected infrastructure telemetry and user experience
- Evaluated and compared performance and user efficiency at completing workflows.
All other system hardware and configuration remained constant, so the observed differences could be tied to the configuration change being tested. This includes the workflows – in this test study, we used foundational Network Information Management workflows but the lessons learned apply to any organization.
| Test | Purpose | Configuration one | Configuration two |
| GPU | Measure the impact of adding a dedicated GPU to ArcGIS Pro desktop editing workflows. | Amazon EC2 R5XL (without a dedicated GPU) | Amazon EC2 G4DNXL with a 16 GB GPU |
| CPU | Measure the impact of adding 4 vCPU to ArcGIS Pro desktop editing workflows. | Amazon EC2 G4DNXL GPU-enabled desktop with 4 vCPU | Amazon EC2 G4DN2XL GPU-enabled desktop with 8 vCPU |
How we measured performance and productivity
To measure the impact of a specific configuration choice, we recorded how long each editor took to complete their workflows alongside the average CPU and memory utilization. This made it possible to compare desktop resource utilization as the editors executed their workflows, step by step.
We focused on three simple questions:
| Questions | What did we do? |
| How was system utilization impacted? | Made one hardware resource adjustment at a time, such as GPU availability or vCPU allocation, while keeping the workflows, data, applications, and backend systems consistent. |
| Did user productivity improve? | Reran the same workflows and compared workflow completion times of both configurations. |
| Was the improvement worth the cost? | Compared the measured workflow execution time improvement with the additional infrastructure expense. |
This provides a consistent, repeatable way to test hardware decisions as workloads, software, data volumes, and infrastructure options change.
What the results show us
Testing impact of GPU-enabled desktops
One key result from our tests was the effect of GPU-enabled desktops on editor’s productivity. The GPU-enabled desktops reduced workflow execution time by 12% to 23% across the tested workflows, as compared to those without a GPU. Having a dedicated GPU also reduced average CPU utilization by 15% to 44% and average memory use by approximately 15% to 16% in the reported workflow comparisons.
In the graphs below, you can see the resource utilization across our Remove Service workflow with (below) and without a dedicated GPU (above). You can see the noticeable decrease in CPU utilization when performing that workflow on a GPU-enabled desktop.


More important than resource utilization improvements themselves, is the impact on the users’ ability to do their work productively. Measured as workflow completion time, the user-experience impact was clear: when editors did their workflows on a GPU-enabled desktop, they were able to complete them on average 19% faster.
All this to say, every workflow took less time to complete with a GPU-enabled desktop, with time savings ranging from 1 to 3.5 minutes. This might not seem like a lot – but can have a significant impact on your business operations when you consider the number of users doing many workflows throughout their workday. To dive deeper, check out the test results here.

The improvement was not isolated to one operation. As you can see in the chart above, most measured workflow steps completed faster with the GPU-enabled desktop (orange), although the size of the difference varied by step.
Testing impact of increased vCPU on desktops
The vCPU tests examined whether additional processing capacity could improve desktop editing performance. It compared configurations with 4 vCPU and 8 vCPU using ArcGIS Pro 2.9.5. Workflows were run under load, with the surrounding system hardware and configuration held constant so the desktop configurations could be compared.
As with the GPU test, the result that matters most to editors is how long it takes to finish their work. Increasing the desktop allocation from 4 to 8 vCPU reduced workflow execution time by 10% overall. However, as you can see in the chart below, the additional vCPU did not accelerate every workflow step equally.

The larger configuration also lowered average CPU utilization by approximately 63%, from about 41% to 48% with 4vCPU to 15% to 19% utilization with 8vCPU (below).
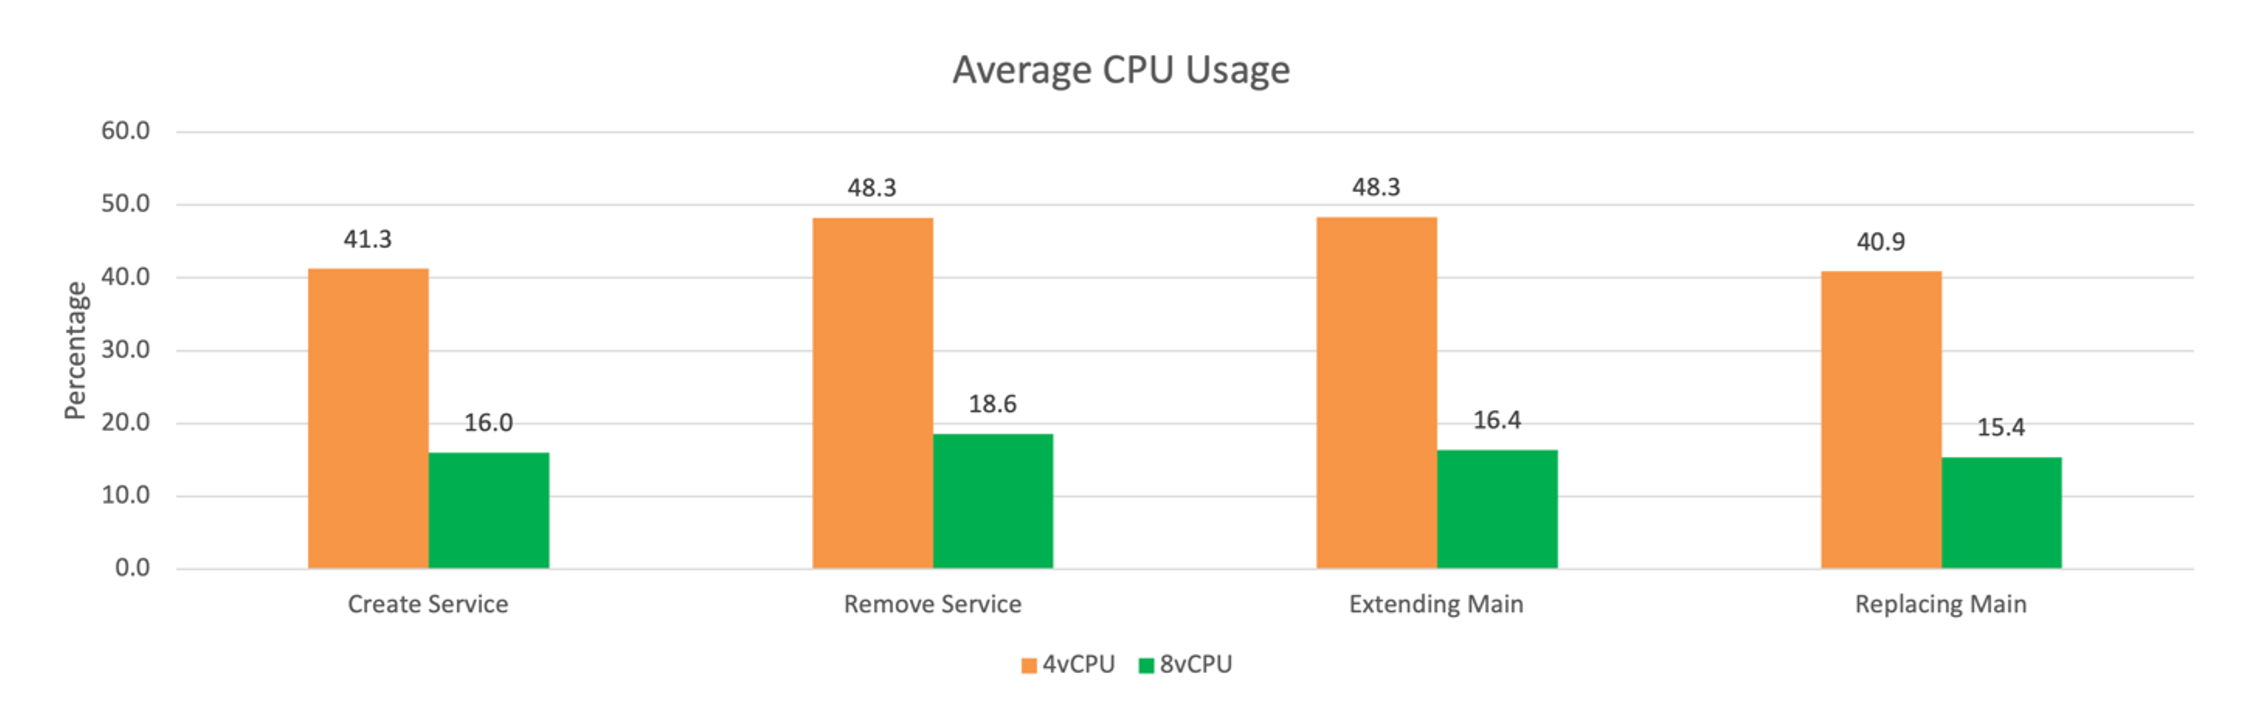
This indicates that the additional processing capacity helped ArcGIS Pro complete the overall workloads more efficiently. The practical lesson is to evaluate additional vCPU by the workflow time it saves and determine whether the resulting productivity gains justify the added infrastructure cost. To dive deeper, check out the CPU test results.
Conclusion: Your users notice seconds
The results point to three practical conclusions:
- Evaluate hardware choices by their impact on your workflows: this shows whether a configuration change helps users complete real work more efficiently, not just whether resource utilization improves.
- Measuring workflow durations across the tests helps us measure user productivity and operational cost savings: saving 1.2 to 3.2 minutes per workflow is meaningful when repeated across users and workdays
- While the exact impact of a GPU or the amount of vCPU will vary based on your system and workflows, both sets of tests show the importance of properly resourced ArcGIS Pro desktops for system performance and end user productivity.
The best configuration is the one that supports real work, improves user experience, and delivers value that justifies its cost.
Start by testing your own representative workflows. Measure the current experience, then compare whether additional CPU capacity or a dedicated GPU produces enough improvement in workflow time and responsiveness to justify the investment.
How you can get started
- Choose one important ArcGIS Pro workflow and capture how long it typically takes as well as resource utilization.
- Test one proposed GPU or CPU change under the same conditions.
- Compare workflow time, telemetry, and observed responsiveness.
- Translate measured time savings into staff productivity and compare that value with the added infrastructure cost.
- Document the result and repeat the test as workloads and infrastructure change.


Article Discussion: