A conceptual walk-through of how ArcGIS and crowd simulation turn event planning data into a predictive public safety tool before the first fan ever arrives.
The Challenge of Managing Safety at a Global Event
When a global sports tournament comes to a city, the excitement is matched only by the complexity. Tens of thousands of fans descend on stadiums and surrounding public spaces simultaneously. Foot traffic surges across multiple city blocks. Temporary infrastructure like stages, tents, fencing, and vendor corridors reshape the built environment overnight. And beneath all of it, public safety teams are responsible for keeping every single person safe.
The question event planners and public safety officials face is not whether to prepare; it’s how to prepare with confidence when the environment itself is temporary and unpredictable. Traditional 2D site plans provide a foundation, but they offer limited ability to visualize and model crowd behavior in 3D, or predict where congestion will emerge before it becomes an issue.
Read on for how ArcGIS combined with a third-party crowd simulation provider can help organizations bridge that gap, moving efficiently from 2D operational data into a fully functional 3D digital twin capable of predicting crowd movement, identifying hazards, sharing actionable intelligence with decision-makers, influencing operational assets, and producing a defined outcome.
Starting Where Organizations Already Are: 2D Operational Data
The most powerful thing about this workflow is where it begins, not with expensive new data collection or building a model from scratch, but with the operational data organizations already have.
Using Esri’s Special Event Operations ArcGIS Solution, event planners can rapidly create a planning scenario for a proposed fan festival zone adjacent to a stadium venue. Within that familiar 2D environment, teams can map the festival footprint, estimate crowd capacity based on available space, calculate fencing costs, and define operational zones, all using existing GIS data and the trusted workflows their teams already know.
This is a critical starting point. Organizations do not need to abandon their existing processes or invest in entirely new platforms to begin building toward a digital twin. The 2D operational layer serves as the foundation; the authoritative record of where things are, how they are configured, and how they fit into the event plan. The transition to 3D is an extension of that foundation, not a replacement for it.
The Special Event Operations Solution is purpose-built for this kind of scenario planning. It surfaces key data indicators such as estimated attendance, fencing perimeter, and entry and exit point counts directly within the planning environment, giving operations teams the critical numbers they need to assess feasibility and communicate plans to stakeholders before a single physical asset is placed on-site.
Extending Into 3D: Low Difficulty, High Value
Once the 2D scenario is established, extending it into 3D is an impactful early step, one that makes it easy for everyone involved to see and understand the environment within this conceptual digital twin. Three dimensions aren’t a requirement for a digital twin, but they are a powerful way to represent a real-world environment in a form that’s intuitive to explore and simple to share. And with ArcGIS, that transition can happen entirely in a web browser with no need for desktop software, specialized 3D modeling tools, or a steep learning curve.
Here’s how it works in practice. The tent locations from the Special Event Operations ArcGIS Solution are already stored as point features. Those points get brought into Scene Viewer, where a published 3D web style is applied to represent each tent as a realistic 3D structure. Simple elevation values ensure each tent appears at the right height off the ground and can easily be adjusted. Rotation, which direction the tent opening faces, is driven by another attribute. The result is a field of accurately positioned, properly oriented 3D tents generated directly from the 2D data event planners were already maintaining. No rebuilding from scratch, no conversion headaches. The same underlying data, now visualized in three dimensions.
What makes this especially practical is that it doesn’t stop at visualization. Planners can select and adjust individual tents directly in Scene Viewer, fine-tuning position and rotation to reflect real-world placement decisions. The underlying attributes update in real time to stay in sync with what’s on screen.
Fencing follows a similarly straightforward path. The fence lines from the solution’s data model are extruded by a height value in Scene Viewer, turning 2D boundary lines into visible 3D barriers. It’s a simple operation with an immediately understandable result that makes an event planning map start to feel like an actual site.
A concert stage and other key event assets can be introduced by uploading 3D models with embedded location information, with the ability to make manual position adjustments to match real-world placement decisions.
By bringing these event assets together in a shared 3D scene, planners, venue operators, and public safety teams can review the site from the same spatial context. That common view makes it easier to discuss operational scenarios, spot potential conflicts, and identify issues before infrastructure is deployed. Seeing the plan in a realistic environment helps stakeholders align more quickly, communicate more effectively, and make decisions with greater confidence.
From Visualization to Analysis
Beyond the structural elements, the 3D environment enables analytical workflows that simply are not possible in 2D. Volume measurement tools, including cut and fill analysis, allow planners to estimate debris removal requirements for site cleanup, which is a practical operational need that 2D plans cannot easily address.
The 3D model is not a static visualization. It is a living, editable representation of the planned environment that teams can iterate on rapidly as planning decisions evolve. Fencing can be added or reconfigured directly within tools like Scene Viewer or ArcGIS Experience Builder. Experience Builder can elevate this workflow further by surfacing key data indicators in real time, reflecting how changes to the physical layout affect capacity and cost estimates. This creates a feedback loop between design decisions and operational implications, making the planning process more rigorous and more collaborative at the same time.
What makes this step so compelling from a value perspective is the relatively low barrier to entry. Organizations with existing GIS data and familiarity with ArcGIS can construct a credible 3D fan festival environment without specialized 3D modeling expertise. The tools are designed to meet planners where they are, using procedural generation, model uploads, and intuitive editing interfaces to accelerate the path from 2D plans to 3D intelligence.
Tapping Into Specialized Providers: Crowd Simulation with uCrowds
With a trusted 3D model of the fan festival in place, the next step unlocks a powerful dimension of the digital twin: predictive simulation. This is where the value of Esri’s open platform paired with specialized providers becomes directly apparent.
The 3D fan festival model can be exported from ArcGIS and handed off to a specialized crowd simulation provider, in this case, uCrowds, a leading provider of crowd behavior simulation. uCrowds applies its simulation engine to the exported model, analyzing how fans will move through the festival space as they enter and exit.
This division of work reflects a mature and practical integration pattern. ArcGIS contributes what it does best: authoritative geospatial data, trusted 3D content, and a platform for planning, sharing, and decision-making. uCrowds contributes what it does best: sophisticated agent-based simulation of human crowd behavior. Neither system tries to replicate the other’s capabilities. Instead, they interoperate and together they deliver powerful results.
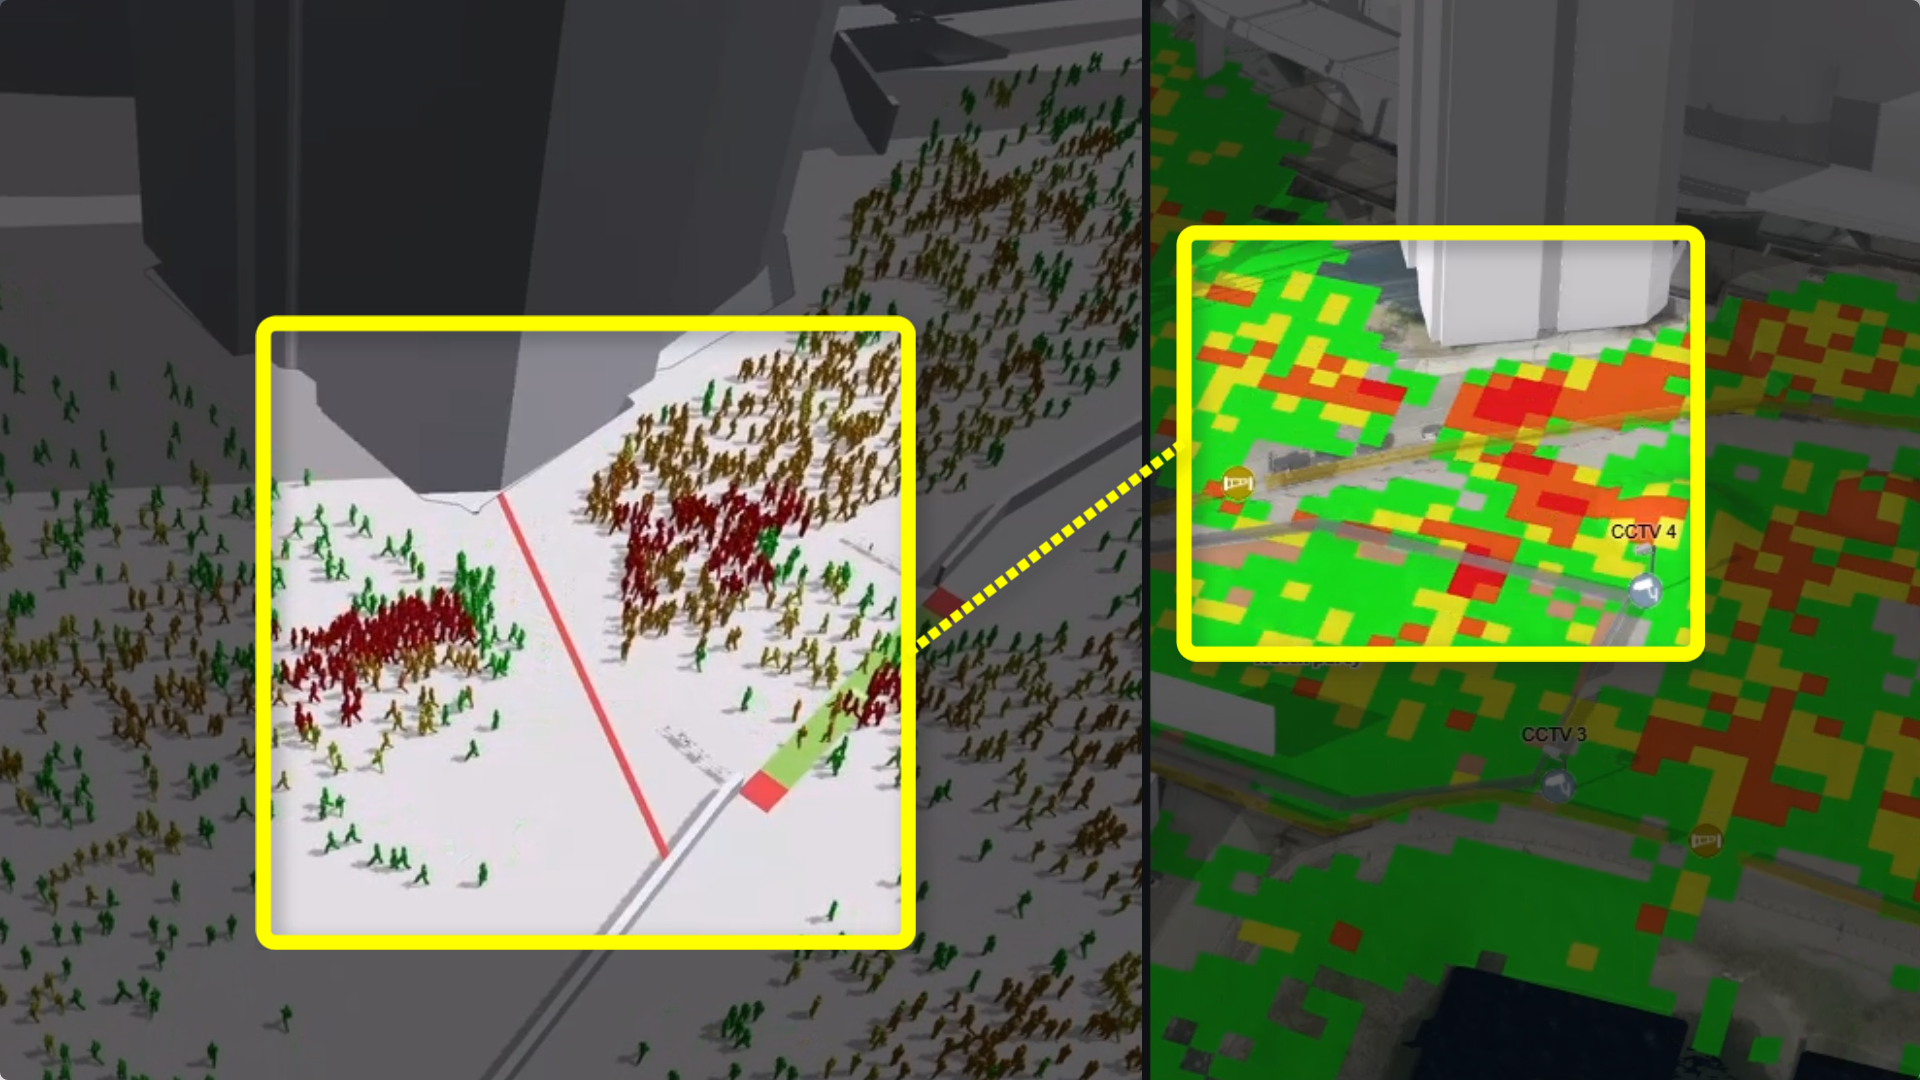
The simulation uCrowds performs is not a simple headcount estimate. It models the behavioral dynamics of individual agents moving through the space, accounting for entry point distribution, pathway widths, bottleneck geometry, and the cumulative effects of crowd density on movement speed. The output is a spatially explicit model of where congestion will form, when it will peak, and how severe it is likely to be.
One scenario that emerges from this simulation is particularly instructive: when stadium visitors exit BC Place at the same time as fans departing the adjacent fan festival zone, the two crowd streams converge and cross paths at specific chokepoints, generating significant, unwanted congestion. This is a risk that would be extremely difficult to identify from a 2D site plan alone, yet entirely predictable once the correct simulation tools are applied to an accurate 3D model.
The simulation also enables planners to test mitigations before committing to them. Closing a specific street segment to vehicle traffic, for example, can meaningfully reshape the pedestrian flow patterns and reduce congestion at key crossing points. These kinds of “what if” analyses are the hallmark of a predictive digital twin, transforming the planning process from reactive to anticipatory.
Streaming Results Back into GIS: From Simulation to Action
Simulation results are only valuable if they reach the people who need to act on them. This is where ArcGIS reasserts its role as the system of record and the platform for operational decision-making.
uCrowds streams its simulation results directly back into GIS, where they are visualized as dynamic crowd density maps. Color coding translates density levels into immediately readable intelligence, with deep saturation indicating high-risk congestion zones and lighter tones indicating manageable flow. Operations teams, public safety officials, and event planners can view these results in a shared environment, discuss implications, and make coordinated adjustments to the event plan.
This integration of simulation results into the GIS environment transforms the digital twin from a visualization tool into an operational planning platform. Design decisions driven by simulation findings, like adding additional fencing to redirect crowd flow, adjusting entry point placement, and modifying crowd departure timing, can be implemented directly within the 3D scene.
The ability to share these results broadly is equally significant. Stakeholders who are not GIS specialists, such as stadium operators, municipal safety officials, and emergency response coordinators, can engage with simulation findings through intuitive map-based interfaces, contributing to planning decisions with full situational awareness of the spatial implications. Because these results can be delivered through web-based 3D experiences, the same operational picture can be shared across planning, public safety, and venue teams without requiring every stakeholder to work in a specialist desktop environment.
Situational Awareness During the Event
The digital twin’s value does not end when the event begins. The same 3D model and operational platform that supported planning can be activated as a real-time situational awareness environment during the fan festival itself.
Staff location tracking provides a critical layer of operational intelligence. During the event, the locations of field personnel can be shared in real time within the 3D environment, enabling supervisors to see where responders are relative to emerging incidents. This can be done using location tracking in ArcGIS or using real-time technology like ArcGIS Velocity to get location from sensors such as public safety radios. In an emergency scenario, the ability to visualize staff movement against the backdrop of the 3D festival layout with incident locations highlighted using glow effects enables faster, more coordinated response decisions.
This operational mode represents the digital twin functioning as a genuine command-and-control environment and not just a planning asset. The digital twin becomes an active intelligence platform integrated into the event operations workflow.
Where This Sits on the Digital Twin Maturity Journey
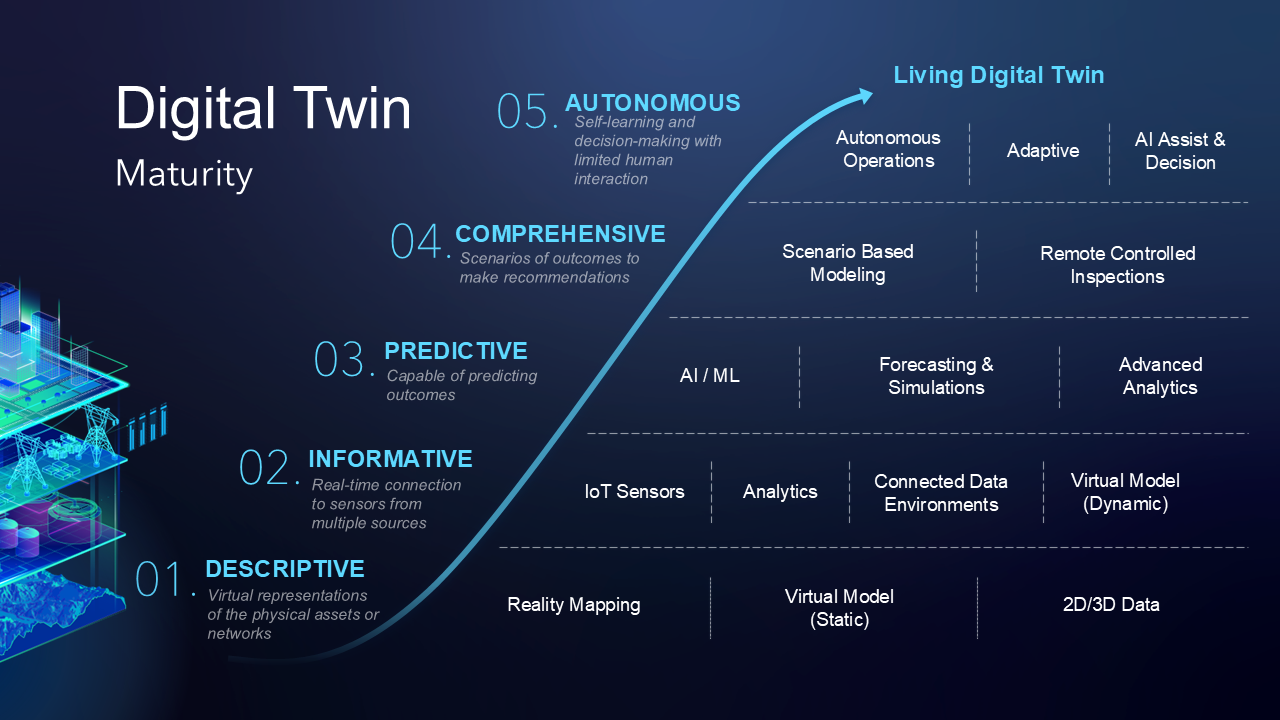
The progression of this digital twin from descriptive to informative to predictive aligns with Esri’s Digital Twin Maturity framework, delivering increasing impact and value at each step. This framework is designed to guide both organizations beginning their digital twin journey and those evolving an existing digital twin into a more capable one.
At the foundational level, a Descriptive digital twin provides a virtual representation of physical assets and networks. In this case, a 3D model of the fan festival environment accurately reflects where assets are located and how infrastructure is configured, forming the operational layout. This first step orients users to a special event plan that is easy to understand and interpret because it is visualized in the same way planners see the world, in three dimensions.
The Informative stage adds real-time connectivity by integrating IoT sensors and live data feeds to synchronize the digital twin with conditions in the real world. Location tracking begins to move the fan festival digital twin into this tier, allowing operations staff to know where security resources are and how best to respond if an incident occurs.
The crowd simulation workflow advances the fan festival digital twin into the Predictive stage of the maturity framework. By modeling crowd behavior before the event, identifying congestion scenarios that have not yet occurred, and testing mitigation strategies against simulated outcomes, event organizers can ensure they are prepared with the best possible plan for smooth crowd movement before the event begins.
The fan festival scenario shows that reaching the Predictive tier of the digital twin maturity curve does not require a complete overhaul of existing systems. It requires a focus on extending trusted 2D operational data into 3D, bringing in real-time data where needed, connecting the right specialized providers for domain solutions like crowd simulation, and establishing GIS as the platform through which results are shared and acted upon.
What This Means for Event Organizers and Public Safety Teams
The fan festival digital twin workflow described here is conceptual, designed to illustrate a pattern of capability that is available today using Esri’s ArcGIS platform, the Special Event Operations ArcGIS Solution, and specialized third-party tools like uCrowds. But the implications for real-world event planning and public safety are concrete and actionable.
For event organizers, the message is straightforward: the GIS data and workflows organizations already depend on for 2D operational planning are ready to support a 3D digital twin. The transition is accessible, iterative, and does not require starting over. The Special Event Operations ArcGIS Solution provides an immediate on-ramp moving from scenario planning and capacity estimation in 2D to a fully spatial 3D model suitable for simulation and stakeholder communication.
For public safety teams, the crowd simulation integration with uCrowds demonstrates something important: a significant advantage for event planners comes not from reacting during the event, but from anticipating conditions before it begins. Identifying congestion scenarios, modeling simultaneous exit from multiple venues, and testing road closure impacts are all tasks that can be completed in the digital twin weeks before the first fan arrives. The operational changes those simulations drive can be the difference between a well-managed event and a chaotic one.
For GIS professionals, the integration pattern unlocks opportunities to tap into enterprise systems, share insights broadly, and deliver value across the organization. ArcGIS does not need to simulate crowd behavior; uCrowds does that. What ArcGIS provides is the authoritative spatial foundation, the interoperability to exchange data with specialized providers, and the platform through which results are visualized, shared, and converted into decisions. This is the pattern that defines a mature digital twin ecosystem.
The Broader Vision: Operational 3D with ArcGIS
What this fan festival demonstration ultimately points toward is a broader vision for how 3D GIS capabilities are maturing within the ArcGIS platform, moving from purely visual representations into genuinely operational environments that support pre-event planning, real-time awareness, and post-event analysis.
The tools that make this workflow possible, including the Special Event Operations ArcGIS Solution, Scene Viewer, ArcGIS Experience Builder, as well as the open integration architecture that connects ArcGIS to specialized providers like uCrowds, represent a logical and accessible path for any organization that manages complex public gatherings. The fan festival scenario demonstrates that path in the context of a global sporting event, but the same workflow applies equally to concerts, marathons, sporting events, and any other large-scale public event where crowd safety is a critical operational concern.
As organizations continue to build confidence with 3D GIS and expand their digital twin capabilities, the fan festival model offers a practical reference point: start with trusted 2D data, extend into 3D with accessible tools, bring in specialized providers for simulation, stream results back into GIS, and use the combined intelligence to make safer, better-informed operational decisions.
The capacity to predict problems before they happen, act on those predictions with confidence, and achieve organization-defined outcomes is what a mature digital twin delivers. ArcGIS, paired with enterprise business systems and specialized third-party tools, enables digital twins that put that capacity in the hands of the organizations that need it most.
Get Started
Explore the capabilities featured in this demonstration:
- ArcGIS Online or ArcGIS Enterprise – Foundational ArcGIS products to enable the fan festival digital twin
- Special Event Operations ArcGIS Solution — Rapidly create event planning scenarios to increase situational awareness during special events.
- Scene Viewer — Extend 2D operational data into high-fidelity 3D environments.
- ArcGIS Experience Builder — Build custom operational awareness applications with live camera feeds, location tracking, and 3D visualization.
- Location sharing or ArcGIS Velocity – Stay informed of field staff location
- uCrowds — Specialized crowd behavior simulation integrated with ArcGIS for predictive event safety analysis.

Commenting is not enabled for this article.