How far would you be willing to drive to a site that offered amenities or services that you consider attractive? The answer to this question is pivotal in analyzing how distance and attractiveness create high or low probability for customers to visit your site. To better understand your customer’s decisions, you can use Huff models in ArcGIS Business Analyst Pro.
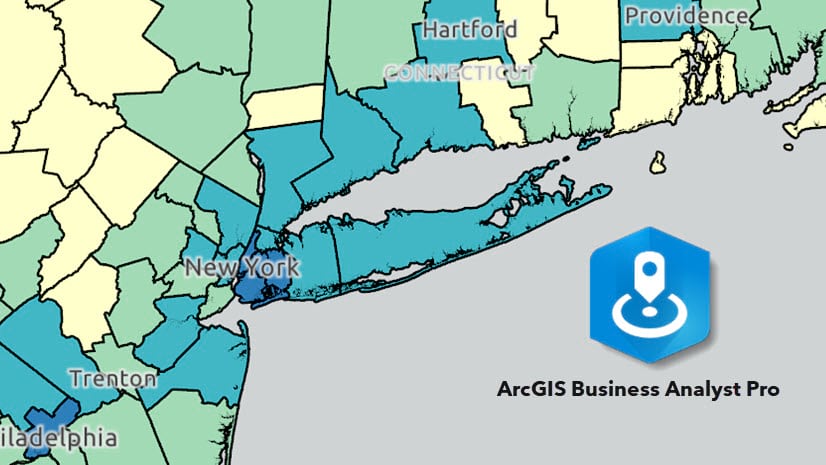
A Huff model is a calculation using attractiveness criteria that generates a color-coded map to represent areas of high to low probability that customers will visit your site. To learn more about the underlying Huff model calculation, see How Huff Model works. The resultant map can be used for benchmarking to see how your site performs in comparison to other locations or competitors. It can also be used to compare how changing the attractiveness criteria improves or hurts the transfer of customers to your site.
Attractiveness in a Huff model represents the quantifiable variables present in your site that you can leverage to gain customers. Why would a customer want to visit your site? The opposite of an attractiveness variable is represented as negative attractiveness. Why would a customer not want to visit your site? You can take a well-known variable (such as sales) and a less well-known variable (which could represent sales potential) to understand the performance of your sites and how it is impacted by the influence of people’s needs and habits in the area. Attractiveness can be influenced by various factors, including accessibility, affordability, local amenities, and more. These elements contribute to the overall appeal of a store location, as they shape customers’ perceptions and preferences. Customized attractiveness variables and units in a Huff model empower businesses to make data-driven decisions.
Access Huff model workflows
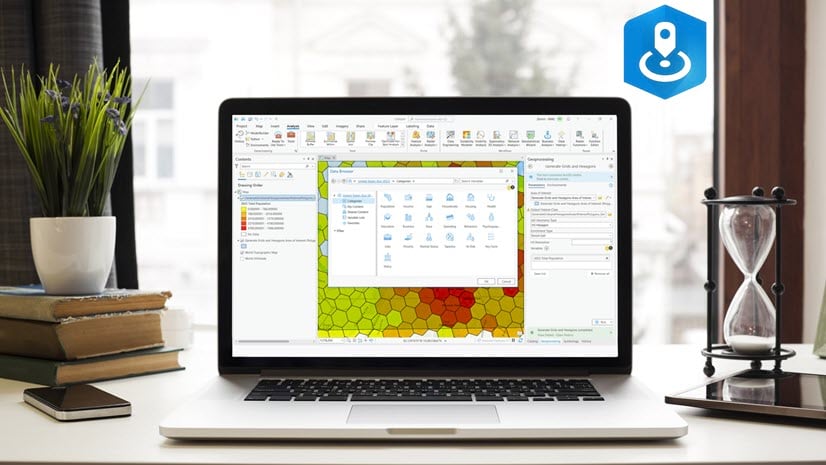
To create a Huff model in the Business Analyst extension in ArcGIS Pro, click the Analysis tab and then click the Business Analysis button to view a curated gallery of Business Analyst workflows.

The Huff model section includes four geoprocessing tools. The Run Calibrated Huff Model and Add a Huff Model geoprocessing tools provide you with quick access to your ArcGIS projects so you can choose and run a previously created model. The Run Huff Model and Calibrate Huff Model geoprocessing tools allow you to create a Huff model.

Understanding exponents in a Huff model
A basic assumption is that the farther away you are from a location, the less attractive it is. Customers at distance have less impact because their patronage is less likely. However, you can look at attractiveness in a much more nuanced way to enrich your understanding of your site and its performance. For example, use the sales per square foot as a measure of attractiveness rather than the gross leasable area. The sales per square foot variable represents the quantifiable sale potential of a site. In comparison, having a greater or lesser amount of gross leasable area does not necessarily correlate with, or quantify, sales potential.
Distance may not affect a customer’s decision to patronize your site as much as other variables. By using variables that represent the attractiveness of your site, you can measure the likelihood of a customer visiting your site, even if they must travel a farther distance. The exponents impact how attractiveness is distributed across your site and competitors. If you vary the exponent in terms of attractiveness, then you can model how the number of sales from your competitors to your site will be transferred. For instance, if your site offers amenities customers want that other sites do not offer, your site is more attractive. As a result, customers are highly probable to use your services rather than your competitors’ services.
Huff model versus calibrated Huff model
A Huff model and calibrated Huff model are different in that calibrated a Huff model has custom distance and attractiveness exponents that you define. By default, the distance exponent is set to –1.5 and the attractiveness exponent is set to 1. These default values may not fit your service area, so customize them for optimal analysis.
It is important to customize your exponents if you have the relevant data available because attractiveness exponents create a power ratio. A power ratio is the measure of how much your site earns in comparison to how much it should earn based on its market share. Setting the exponent to 1 neutralizes the power ratio. However, consumer behavior shows that people display brand loyalty. It could be valid to look at two different franchises that are equal or to look at a new franchise on the market that could be more attractive to customers.
Customize the units in a Huff model
It is also necessary to customize the units when creating a Huff model. Specifically, the type of distance based on method of travel impacts how attractive your site is to customers. Driving time or driving distance changes the mode. For instance, is this site easier to get to, or is the site faster to get to? Sites near freeways may be more attractive to a person that patronizes a site during their commute from work. Alternately, sites with amenities may be more attractive because of the ease of experience for the customer. The accuracy of the model depends on the parameters you use.

Expand a Huff model’s analysis space
A Huff model is constrained by the space that it represents. It is recommended that you extend the frame of your analysis to include potential catchment areas. Catchment areas are geographic areas that are measured by population density and subject to change as the population changes. If you don’t use catchment areas, the features at the end of the model are less valid since anything beyond them is not included in the analysis. After running a Huff model, you can modify the extended frame. Use straight line analysis to capture the specific area that you are targeting by changing the underlying areas to exclude places outside of your boundary. This methodology acts on the idea that customers further from the site will still patronize it because your site is attractive enough to them.
Additional resources
For more information on Huff models in ArcGIS Business Analyst Pro, check out these resources:
- Create a Huff Model
- How Huff Model works
- Huff Model Calibration with ArcGIS Business Analyst Pro
- An overview of the Modeling toolset
Card image courtesy of Scott Graham on Unsplash.
Banner image courtesy of Using Huff Model Calibration in Business Analyst Pro.

Article Discussion: