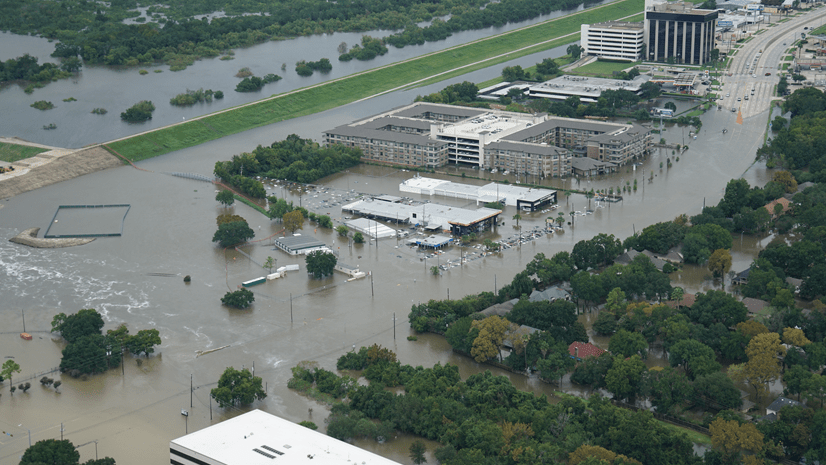
Flooding is one of the costliest and most frequent natural hazards in the United States. When essential services such as grocery stores, gas stations, and pharmacies are disrupted, entire neighborhoods can quickly lose access to food, fuel, and medicine. Understanding where these vulnerabilities exist is critical for both public and private sector decision-makers.

This blog article demonstrates how analysis performed in ArcGIS Business Analyst Web App can help identify and protect community assets before disaster strikes. By overlaying FEMA’s USA Flood Hazard Areas from ArcGIS Living Atlas with business location data from Data Axle, we can reveal which critical services lie in high-risk flood zones—and how those risks affect the people who depend on them.
We chose the Meyerland neighborhood in Houston, Texas (ZIP code 77096) because it’s one of the city’s most flood-prone areas, repeatedly impacted by major storms like Hurricane Harvey, Tropical Storm Allison, and Tropical Storm Imelda. The area of interest follows along Brays Bayou, a watershed notorious for frequent flooding and high-density residential development, making it an ideal case study for examining where community access is most at risk from flooding.
Who benefits from this work
This workflow, evaluating essential businesses in flood-prone areas, supports a wide range of users:
- Local government: City and county planners can pinpoint flood-prone corridors that may need infrastructure upgrades or new drainage improvements.
- Emergency management: Emergency managers can identify neighborhoods that will lose access to essentials like groceries or pharmacies during a flood and plan resource distribution accordingly.
- Commercial sector: Businesses and retailers can evaluate flood exposure before opening new stores or warehouses to improve long-term operational resilience.
- Nonprofits and community groups: Community organizations and public agencies can target outreach and preparedness efforts for residents who rely on these services.
By bringing together natural disaster hazard data and business data, this analysis builds a shared understanding of vulnerability that bridges public safety and business continuity.
Data and method
This workflow can be completed with a Standard license in ArcGIS Business Analyst Web App. The analysis uses authoritative data from ArcGIS Living Atlas of the World and Data Axle business listings point of interest (POI) data to assess flood exposure for businesses in Meyerland.
- Define the study area
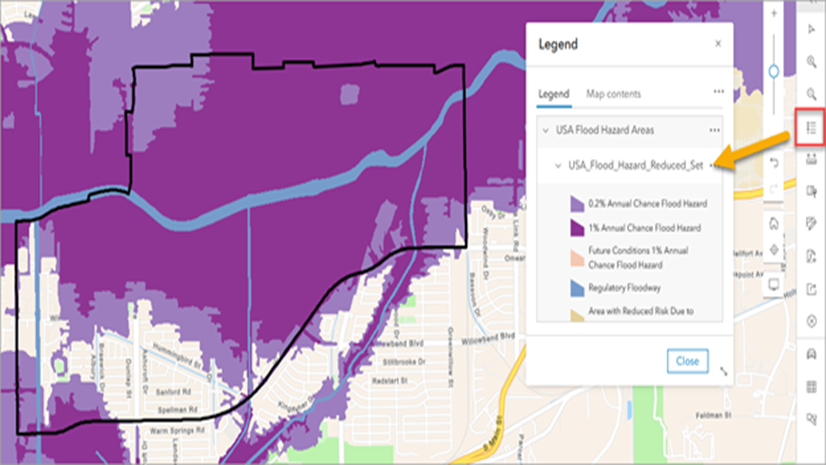
First, we’ll map the ZIP code containing Meyerland. From the Define Areas menu, click Select geography and then Search. We entered the ZIP code in the search field to create our site for the analysis:

This ZIP code covers most of the Meyerland neighborhood and surrounding flood-prone areas along Brays Bayou.
To ensure clear visibility when overlaying flood zones and POIs, we styled the ZIP code boundary by selecting No fill. We updated the border color to make the ZIP code boundary easier to identify during analysis.

- Add flood hazard data
Next, we added the USA Flood Hazard Areas layer from ArcGIS Living Atlas using the Add web maps and layers workflow.

This dataset incorporates FEMA flood classifications, showing areas at varying degrees of flood risk:
- 1 % Annual Chance Flood Hazard (100-year floodplain)
- 0.2 % Annual Chance Flood Hazard (500-year floodplain)
- Regulatory Floodway
These distinctions help differentiate between occasional and extreme flood risk. Opening the legend on the web map shows how the flood hazard layer represents the demarcation of flood inundation zones. A large majority of the ZIP code covering the Meyerland neighborhood is within a flood zone.

- Add essential business locations
Next, we’ll perform a points of interest search to map business that represent essential services. Under Create maps, click Points of interest (POI) search. Use Data Axle as the POI data source and search by Category for:
- Grocers-Retail
- Pharmacies
- Service Stations-Gasoline & Oil

We named and saved the search “Essential Services.”

- Style and overlay the data
We overlaid the essential-service points directly on the USA Flood Hazard Areas layer to visually confirm which facilities fall inside the 1% and 0.2% annual chance flood zones (and note any within the Regulatory Floodway).
Selecting the Style section of the workflow pane, we used the drop-down menu to choose Place to symbolize each business location based on the category of services that business offers. Then select Show style options and toggle off Cluster points.


- Summarize and interpret results
The resulting map reveals a dense concentration of essential services running parallel to Brays Bayou, much of which lies inside the 100-year floodplain. Several pharmacies, grocery stores, and gas stations overlap directly with high-risk flood zones, underscoring how floods can quickly disrupt critical supply chains.
In contrast, a few facilities along the southern and western edges of the ZIP—outside the flood zone—could serve as temporary alternatives when central Meyerland businesses are inaccessible.

Looking at the Results pane, we identified 159 essential business locations in the Meyerland area. The top business types include:
- Pharmacies (47)
- Grocery & Retail (43)
- Gas & Service Stations (40)
- Convenience Stores (16)
Roughly 56% of these are independent businesses, with most having fewer than 10 employees—highlighting how small, locally owned stores are disproportionately affected by flood events.

We can even filter independent businesses to see where they are in the existing flood prone regions. In the Filters section select Show filters, under the field Business Category select the value Independent.

- Share results
You can share your results as an ArcGIS web map directly from the Business Analyst Web App (available with a Standard license) to your ArcGIS Online Organization. Under Share results select ArcGIS web map to create a new web map containing the essential business POIs and the USA Flood Hazard layer. You can edit these layers—e.g., customize pop-ups for the essential businesses — or use the data for further analysis. The web map can also be embedded in apps and shared with stakeholders, the community, or other departments within a local or state government through your ArcGIS online organization.


Conclusion
Flood events like Hurricane Harvey have shown that community resilience depends on more than just levees and drainage—it depends on access. When pharmacies or grocery stores are under water, neighborhoods can be left stranded for days.
By using ArcGIS Business Analyst Web App with Living Atlas flood data and Data Axle business listings, local governments, emergency planners, and businesses can proactively identify where vulnerability meets necessity—and make informed decisions about mitigation, relocation, or disaster response.
The Meyerland flood prone essential business case study illustrates how location intelligence can help cities protect what matters most: the essential services that keep communities running when it matters most.


Article Discussion: