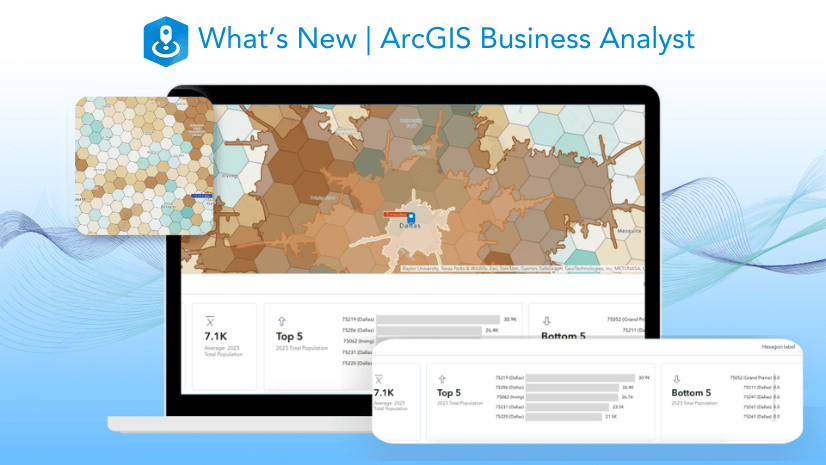
As part of the February 2024 release, ArcGIS Business Analyst Web App has an updated and redesigned suitability analysis workflow. The suitability analysis workflow identifies and scores sites that meet specific criteria. Enhancements to this workflow include:
- Hexagons are now available as a geography option in resolutions 2 through 7 for the United States.
- A set of curated variable lists, including ones by industry, are available for analysis.
- The ability to select from multiple scoring methods to customize how the suitability values are calculated.
- Suitability analysis results are now populated in the new Results pane, featuring a summary, histogram, bubble chart, and downloadable table.
In this blog article, we are performing suitability analysis to update an emergency response plan for an emergency services organization in Texas City, Texas. We need to identify which communities are more at-risk so that the emergency services organization can better prepare for the needs in serving or evacuating that community.

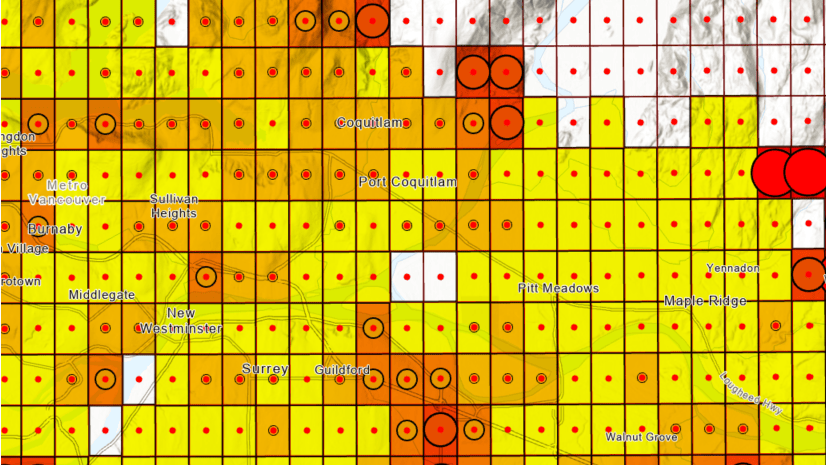
For this analysis, we are using hexagons as a geography option. Hexagons are now available to Advanced users in the color-coded map, smart map search, and suitability analysis workflows as part of the February 2024 release. Hexagons are used in geographic analysis to visualize the distribution of data on a map, independent of traditional administrative boundaries. The data is aggregated into six-sided polygons, providing an efficient and uniform representation of the data. Hexagons in mapping are optimal when the analysis considers issues of connectivity and proximity as crucial aspects to understanding the interactions of place-based data.
Use hexagons as a geography option.
To start the suitability analysis, click the Geographies or hexagons location type. In the Analysis extent search field, type Texas City, Texas. Select the county subdivision result.
Let’s use hexagons in our analysis. Click the Hexagons tab in the Level of detail section. Change the hexagon resolution to 7. (The size of the hexagons is referred to as the resolution.) This is the smallest hexagon resolution available in Business Analyst Web App. This resolution allows for a more localized visualization of data patterns as each hexagon covers a smaller area. To learn more about hexagon resolutions, see Calculations. Once you have made the hexagon resolution change, click Next to proceed.

Select your criteria.
We can use the Featured lists tab to select from curated variable lists for different industries. Expand the State and local government variable list, then click At-risk.

The at-risk variables automatically populate on the map layer and in the Results pane.

Modify the preset scoring method.
The updated suitability analysis workflow for the February 2024 release now provides you with more control for selecting the scoring methods used in calculations. The suitability scores are calculated in a three-part process: preprocessing, combination, and final score scale.
- Preprocessing methods: This step standardizes the criteria to a common scale. This improves the data reliability by making it more consistent and comparable.
- Combination methods: This step combines the criteria into a single value.
- Final score scale: This step transforms the combined score into meaningful final score values. You can scale the final score from 0 to 1, 0 to 100 or preserve the distribution of the combined values.

In Business Analyst Web App, the preprocessing and combination methods are available as common preset processing methods or as custom selections. The preset processing methods are Combine values (default) and Compound differences. If you opt to make custom selections, you choose the preprocessing and combination methods. Preprocessing methods include Minimum-maximum (default), Percentile, Z-score, and Raw values. The combination methods include Sum, Mean, Multiply, and Geometric Mean. To learn more about the scoring method options in suitability analysis, see Calculations.
In addition to choosing the scoring methods, you maintain the capability of modifying the type of influence, threshold range, and weight of criterion. Previous Business Analyst Web App releases were limited to only modifying the criteria in suitability analysis and did not enable you to choose scoring methods.
Let’s modify the preset scoring method used in our suitability analysis.

By default, the Combine values method is selected. Instead, click the Compound differences present method. The Compound differences preset method is less sensitive to outliers, therefore extremely high or extremely low values do not disproportionately impact the overall site score.
Modify the final score scale.
The final score scale is automatically set to score the sites from 0 to 1. Let’s change the Final score scale to 0 to 100. This provides a broader score range that the emergency services department can use to understand the levels of risk for the community.

Explore the results.
Now that we’ve ranked the hexagons, we can see which communities are most at-risk in Texas City. A high suitability score indicates a high at-risk score, which is color-coded red on the map. Hover over a red site on the map and view the pop-up with the criterion value and score.

For more detailed information on the results, explore the new Results pane. The Results pane has four tabs, including:
- The Summary tab has an overview of the top five ranking sites.
- The Histogram tab visualizes the suitability analysis results. You can change the variable visualized by clicking the Variable drop-down menu.
- The Bubble chart tab visualizes the suitability analysis as a bubble chart or scatterplot. The variables used to create the chart can be modified in the Chart settings section.
- The Table tab features the tabular version of the results.

When we’re done performing our suitability analysis, click Save layer to store it in our project for future use. This information can be used by the emergency services organization to update their response plan by identifying which specific communities in Texas City are most at-risk and therefore need greater care in emergencies.


Article Discussion: