Business Analyst software offers many powerful tools to help you better understand spatial patterns in your data. This article is part of the blog series Got five minutes? Get to know… where we pick datasets and tools to highlight. We provide a brief overview of what this tool does and how you can use it so you can be up and running quickly!
- What are hexagons in GIS?
- What size hexagon do I use?
- What is the difference between Uber H3s and regular hexagons?
- Why should I use H3 hexagons in my analysis?
- How are hexagons created in Business Analyst?
What are hexagons in GIS?
Hexagons are similar to traditional square grids used in GIS, but instead of squares, the grid is made up of six-sided hexagons. In this article, we’ll focus specifically on using Uber H3 hexagons for your Business Analyst workflows in ArcGIS Pro.

Uber H3 hexagons are a widely adopted global grid system. Each hexagon in the grid is a similar size and has an index ID that never changes—these aspects offer a number of advantages for analyzing data. Above, you can see standard Uber H3 hexagons mapped over Santa Barbara, California using Business Analyst’s Generate Grids and Hexagons tool in ArcGIS Pro.
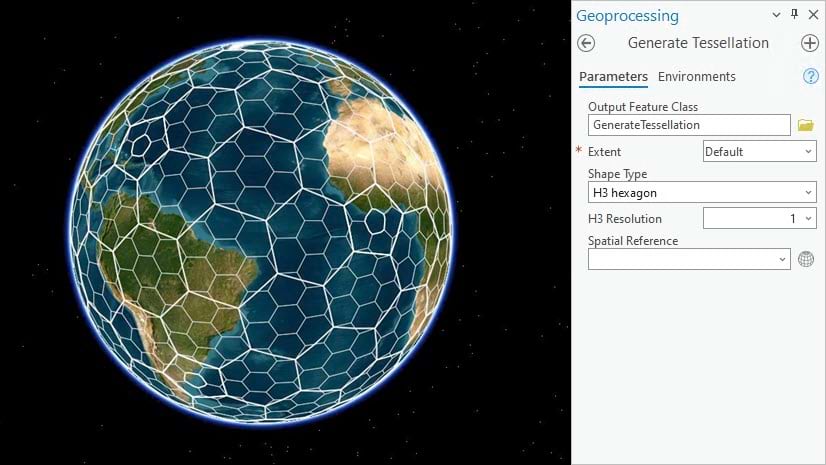
Note: You can also create hexagons outside the Business Analyst toolbox, using the Generate Tessellation geoprocessing tool in ArcGIS Pro, but you cannot enrich them directly this way. For more information about this tool, read Use H3 to create multiresolution hexagon grids in ArcGIS Pro.
What size hexagon do I use?
An H3 hexagon grid can be generated with hexagons on a defined size scale of 0 (largest) to 15 (smallest). All sizes are supported in Business Analyst. You should choose a size that is appropriate to your analysis. For example, a level 1 hexagon layer will be far too large for neighborhood-level investigations, but may be appropriate for state- or country-level analysis.

Note that size and edge length of hexagons may vary depending on resolution.
The figures above depict average edge lengths.
See: Tables of Cell Statistics Across Resolutions, Uber H3
What is the difference between Uber H3s and regular hexagons?
The H3 system was created by Uber to cover the entire globe and made public for widespread use in 2018. Though it was possible to create hexagons in ArcGIS Pro before the advent of H3, this indexing system quickly became a cartographic standard.
A big advantage of using H3 hexagons for analysis is that they’re so widely used. It means your map will line up with others’ maps by virtue of using the same geographic mesh. If, however, you want to make your own custom, non-Uber H3 hexagons, you can still do so.
Why should I use H3 hexagons in my analysis?
H3 hexagons offer consistent, unchanging coverage over your geographic area.
No need to worry about administrative boundaries that don’t line up or that change over time. H3 hexagons are independent of traditional administrative boundaries and align seamlessly across them, wherever you are in the world.
Here’s an example where this could be beneficial: Let’s say you want to examine how the number of insurance businesses in your area has changed over time. Your plan is to summarize at the census tract level, when suddenly you realize—the census tract boundary has been redrawn since the last census! Businesses that used to be in tract “X” now fall into tract “Y”. Since the boundaries have changed, it is much more difficult to make an apples-to-apples comparison of present to past.
However, you could use H3 hexagons with your previous and current business datasets to make the comparison instead. And, if an analyst in an adjacent town wanted to do a similar study, their H3 hexagon results will line up seamlessly with yours since the H3 hexagon grid is global.

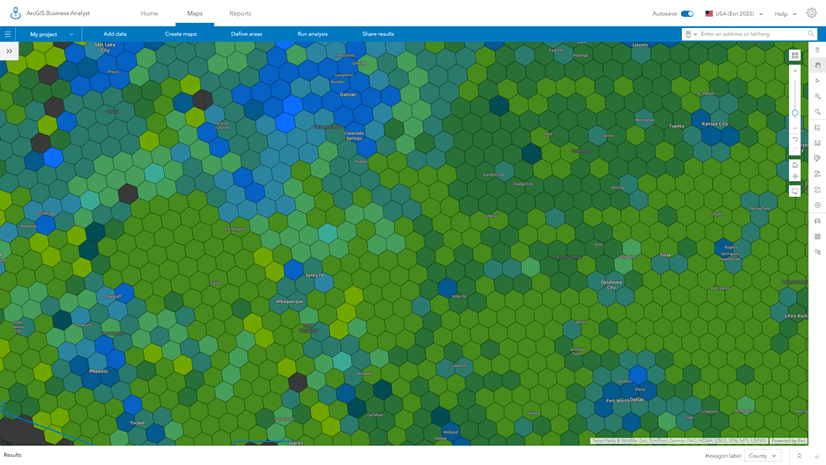
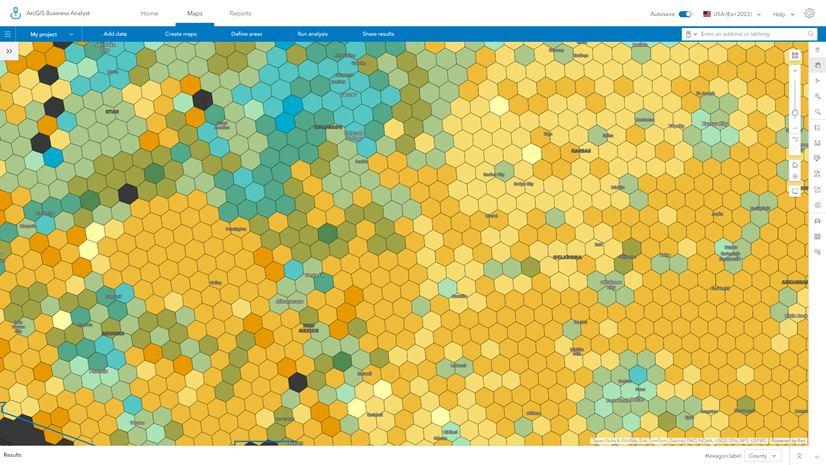
Point locations can be aggregated to a consistent grid.
Hexagons are great for summarizing points contained in them and quickly seeing differences in point densities.
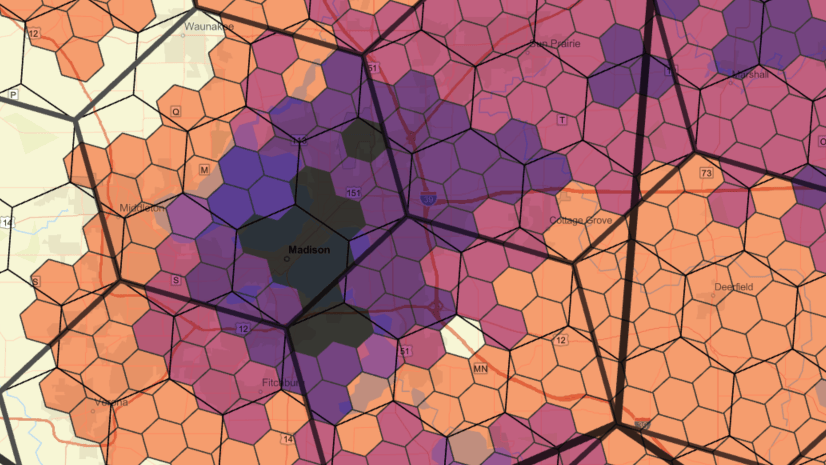
An example is shown in the map below. The points represent business locations from Business Analyst that are categorized as Automotive Repair, Services, and Parking (SIC Code 75). Using the Pro tool Summarize Within, the points have been counted and assigned to their underlying hexagon.

It’s easy to see where there are clusters of these businesses based on the color-coded hexagons. If you are an automotive supply business—or any business wanting to target areas where you can sell your goods and services—this could be a great tool.
How are hexagons created in Business Analyst?
Hexagons can be created using the ArcGIS Pro Business Analyst tool Generate Grids and Hexagons.

Before running the tool, there is an option to enrich the hexagons. This means that when the grids generate, they will already have values for variables you are interested in. In the screenshot below, the hexagons will be enriched with Esri Median Home Value and ACS Median Year Structure Built when they are generated.
Alternatively, you can just generate H3 hexagons with no data attached to them by leaving the Enrichment Type box blank. You can always use the Enrich Layer tool later if you decide to enrich your hexagons.

Here’s the output from generating enriched level 8 H3 hexagons over the downtown Portland area. The hexagons are symbolized by their enriched values for Esri Median Home Value. Now it’s time to start looking at patterns and trends.

Keep in mind that enrichment of H3 hexagons produces the best results at levels 0 thru 9…think roughly the area of three football fields or greater. By H3 level 10, the underlying population data model is coarser than the hexagons that are being enriched, resulting in poor levels of confidence. Enriching hexagons in rural areas may also generate poor results, since the sparseness of data tends to generate many “no value” hexagons.
We encourage you to use Business Analyst to explore the world of hexagons—it’s a whole new way to analyze your data! Keep an eye out for more data-related articles in the Got five minutes? Get to know… blog series.
Note:
This article was updated on 5/15/2023 to reflect that hexagons, while similar in size, are not always uniformly equal in size. This article was updated on 7/31/2025 to reflect the latest data source and geoprocessing interface.


It’s a proven scientific fact that the hexagon is the bestagon.
I’ve googled it, but am not understanding bestagon. Also, I’ve wondered if there is an advantage to using hexagons vs. square tiles.
In the example given, couldn’t a simple heat map accomplish the same thing?
Also, Pro is very good at creating hexagon-based board game maps. 😉
Thank you so much for this informative blog.