With ArcGIS Business Analyst Web App, creating an area around a chosen location based on distance or time has always been easy. In a few clicks you can add a drive time, walk time, or a simple buffer ring around your point of interest on the map. It’s simple and quick!
But what if you want to determine the area of coverage around a location needed to satisfy a demographic value, for example: What distance is needed to reach 30,000 millennials or how far of a drive will capture $1M of product sales?
We have heard your requests! In the most recent release of the web app (Advanced license), you can do just that. The new tool, called Threshold Areas, is based on a tool currently available in ArcGIS Business Analyst Pro.
Why would you want a threshold area?
A threshold area is useful because it geographically represents the desired value of a given variable around the chosen location. You might, for example, want to know what area around a location includes a population of 25,000 people or what area represents a Consumer Spending value of $1,000,000.00. Such an area might be the perfect fit for the new location of a business, a new health clinic, or a new warehouse. Using these insights, you are truly leveraging the “Science of Where” in your decision-making processes.

Creating a threshold area
Let’s say, for example, you are doing market analysis for a small retailer. You know the ideal market for one of their stores is 25,000 people within a 5-minute drive. You are considering two locations in the Syracuse, NY area and you want to see if either of these locations would be a good candidate for a new store location. Your goal is to determine whether either location encompasses a population of 25,000 people within the ideal 5-minute drive.
To launch the new workflow, open the Run Analysis section of Business Analyst Web App—the same area that contains Suitability Analysis and Void Analysis—and click on the Threshold Areas workflow.

There are three ways to start the workflow. You can create threshold areas from a single location (by entering an address or dropping a pin), from point locations in an existing point layer, or from the locations of existing sites in the project. Thresholds can take a while to process, so currently a maximum of ten locations can be run by the workflow at one time.

In this case let’s start with the third option, creating threshold areas from existing sites, since we have already mapped the sites of interest in our project. This option will use only the locations of the existing sites to create the new threshold areas (leaving the original sites unchanged.) After selecting this option and clicking Next, you will see the Add Sites dialog box. Now, select the two sites of interest in the Syracuse area.
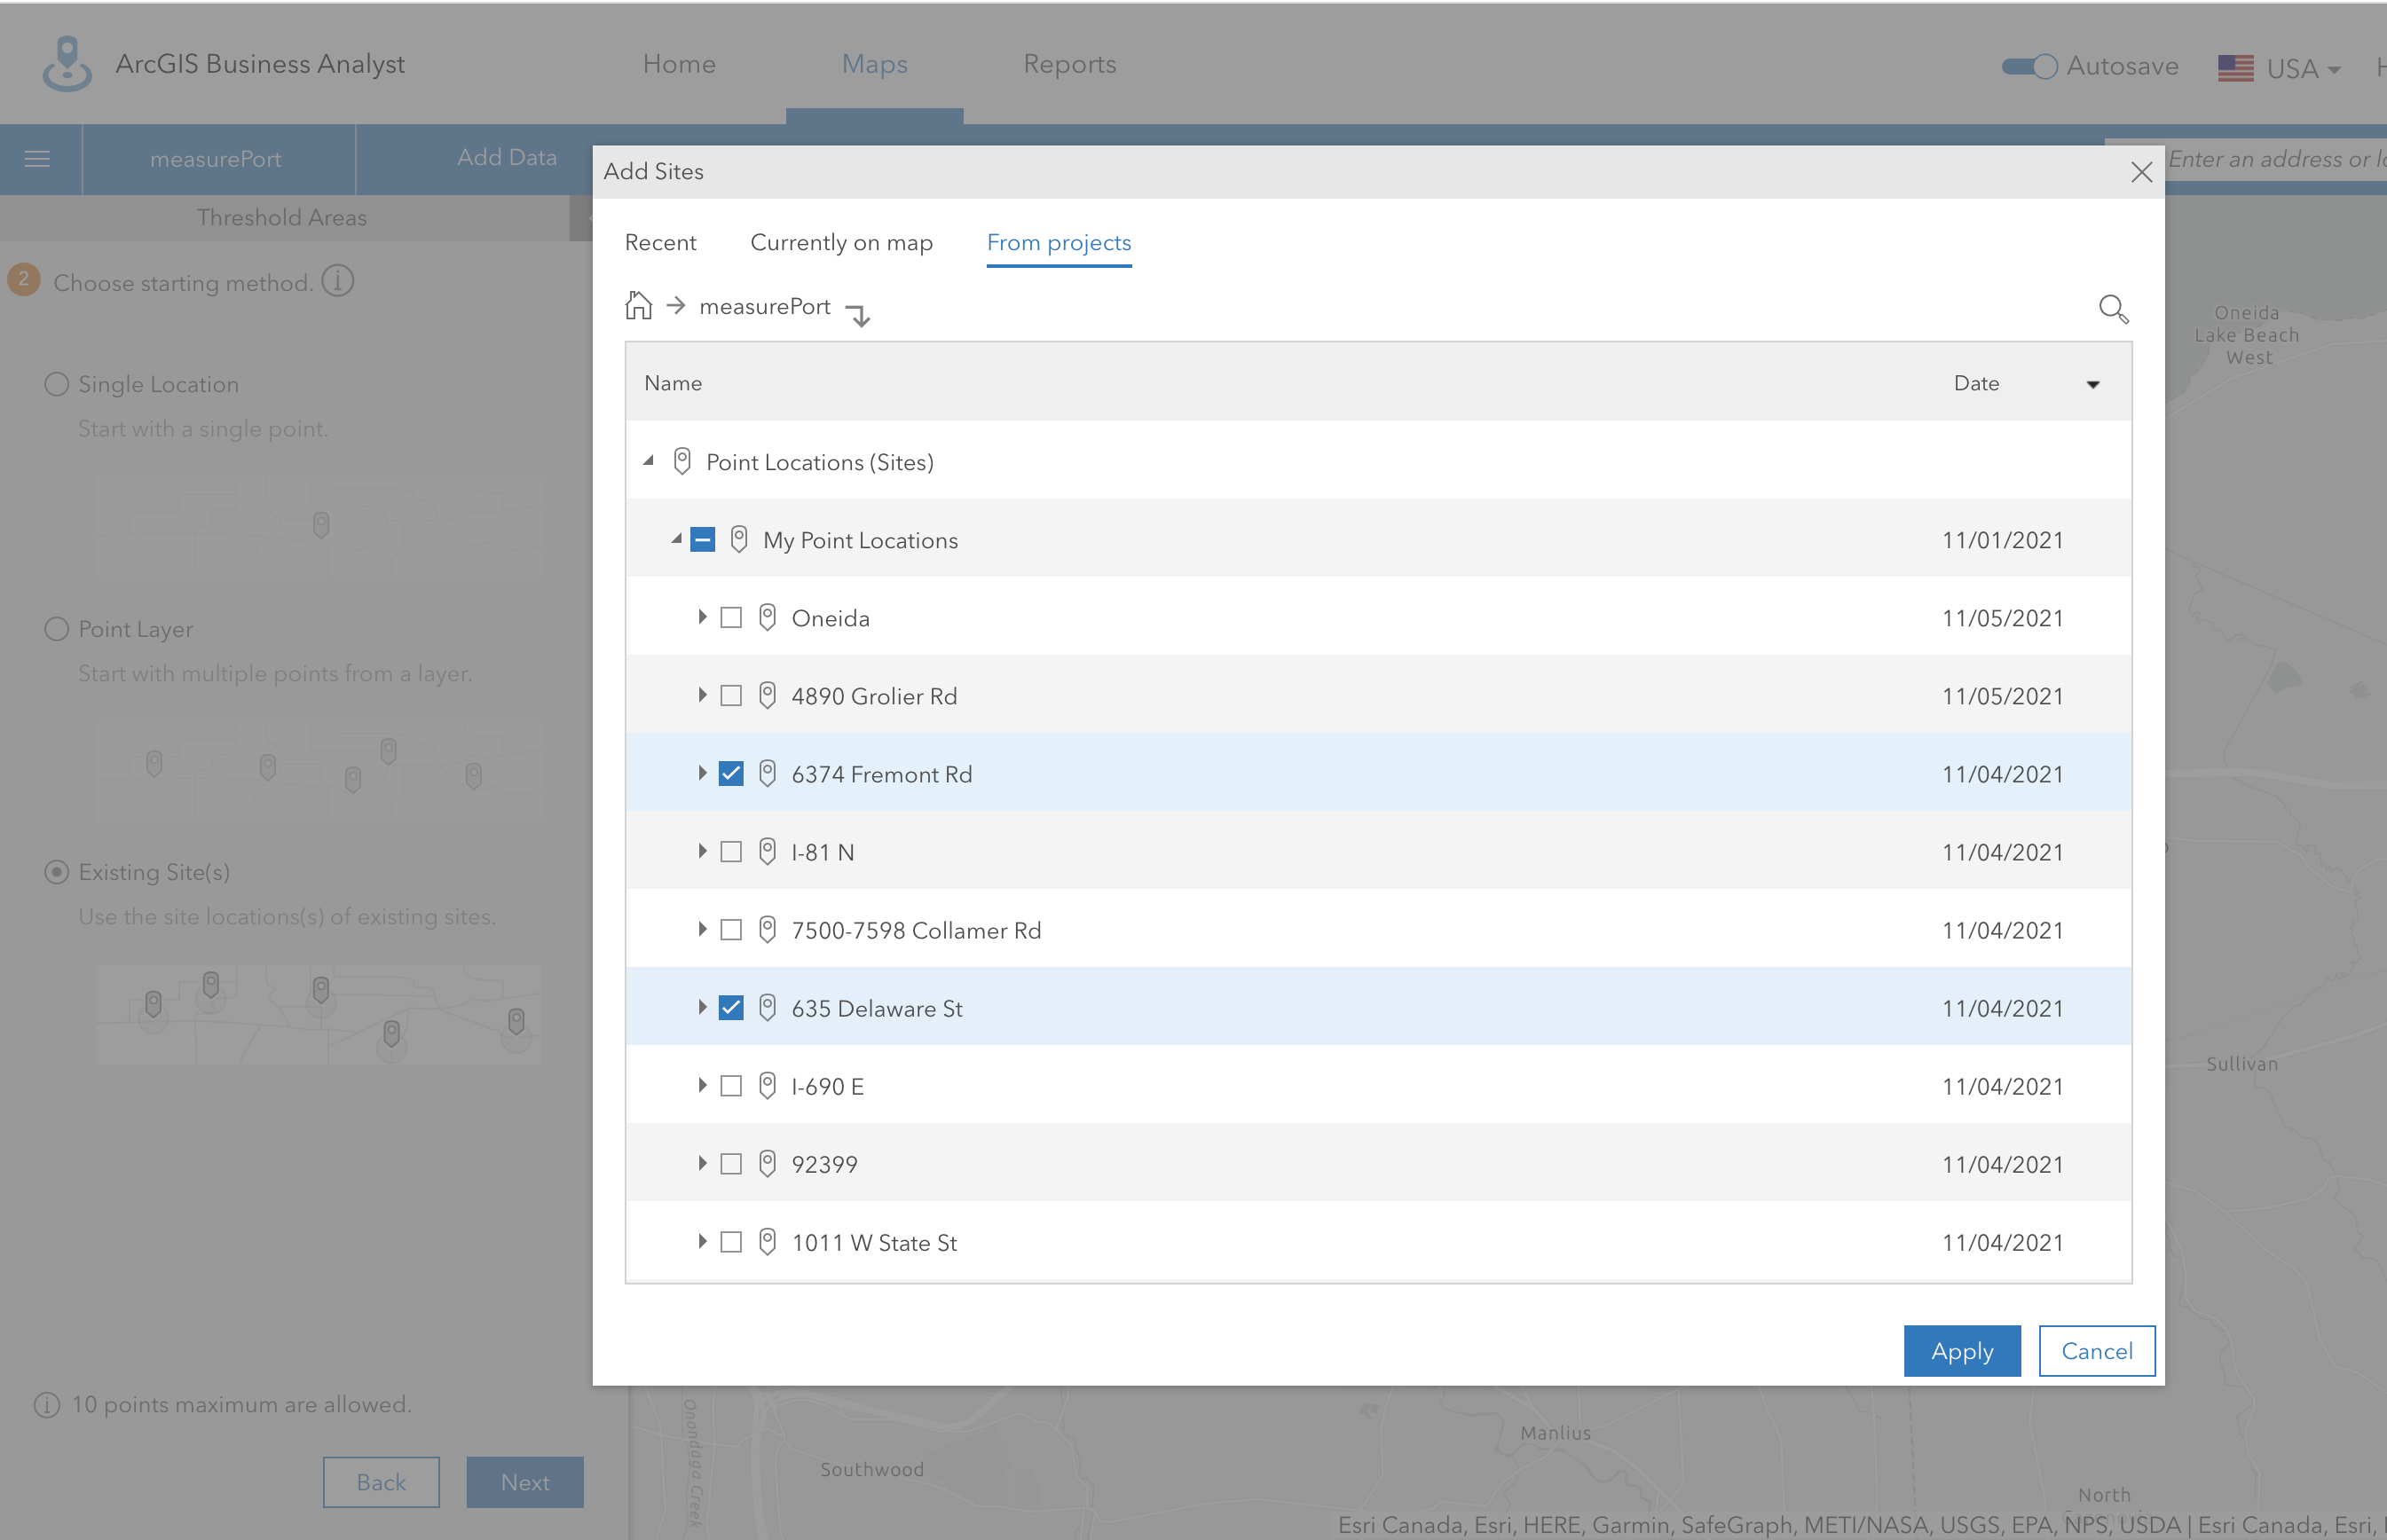
Click Apply to add the selected locations to the map. Since we are using the site locations as starting points, the original site is shown as a transparent reference and will not be used in the generation of the threshold areas.
Setting the threshold
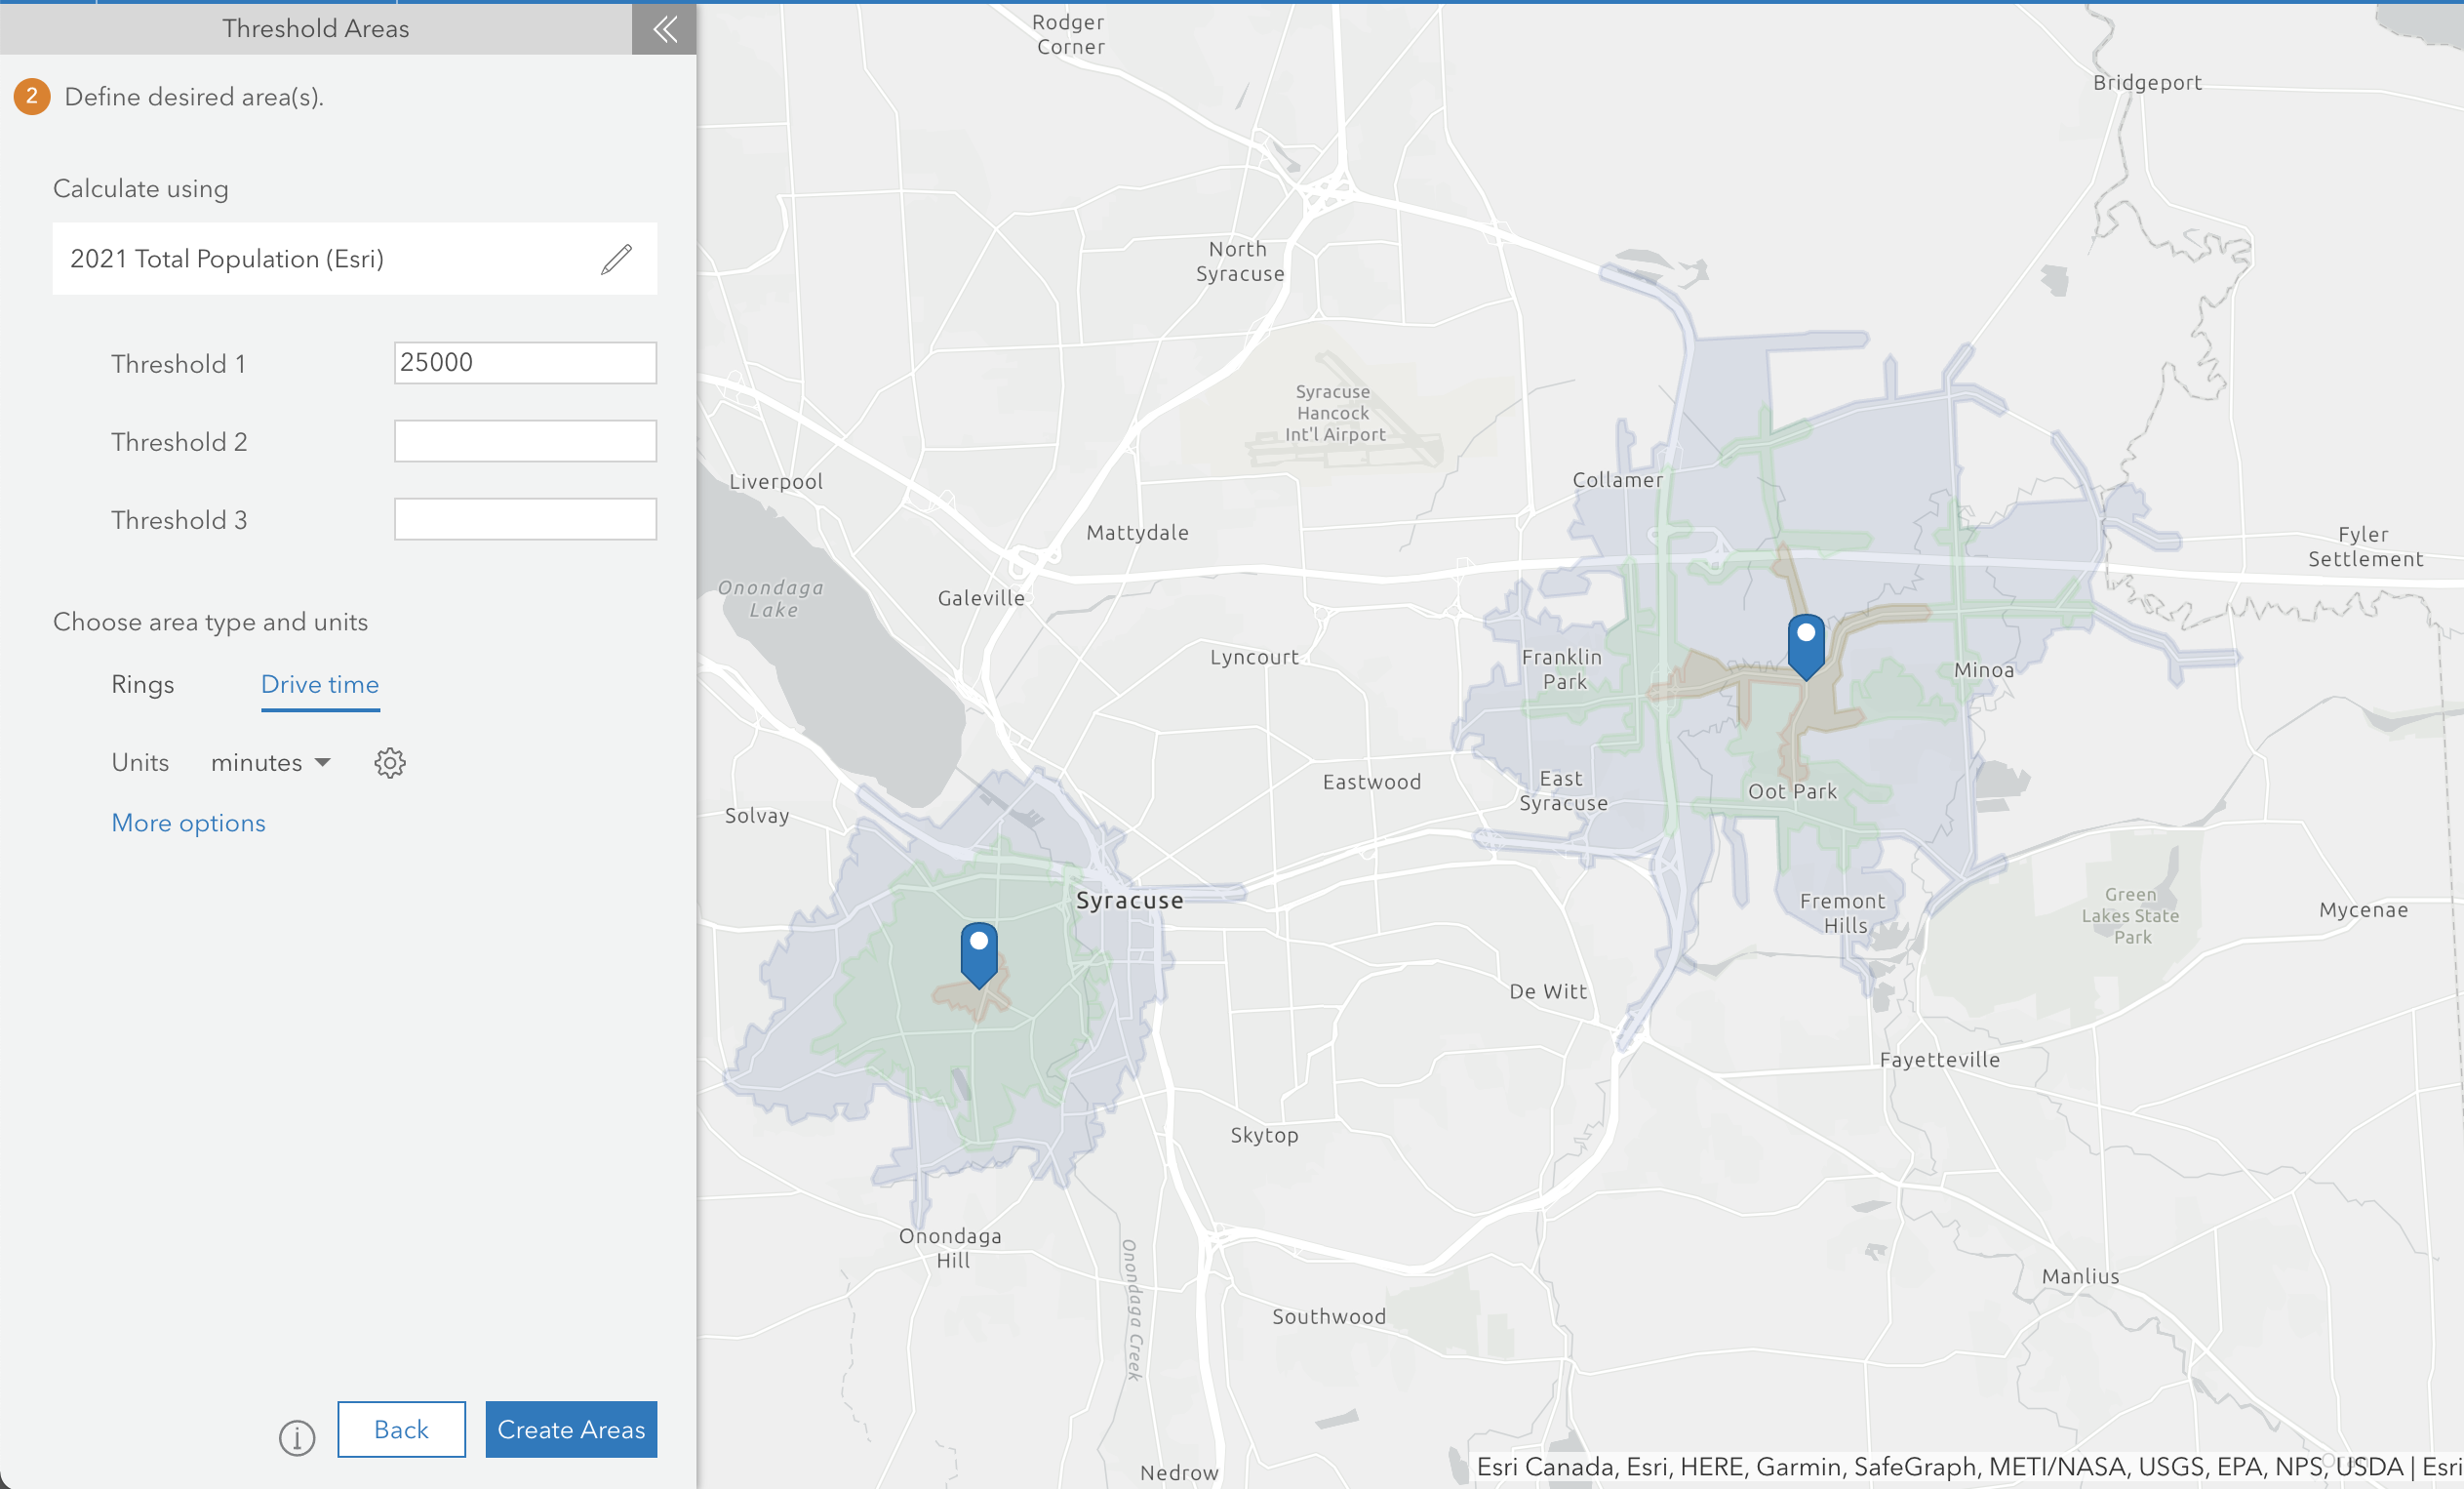
The next step is to set your threshold variable and desired thresholds. The threshold variable is set to 2021 Population (Esri), by default. This is an overwhelmingly popular variable for threshold analysis, but if it doesn’t meet your needs, you can click on the edit button at right to change the variable. You can choose another preselected variable or click Browse variables at the bottom of the drop-down menu to open the Data Browser, where you have access to all summarized variables in the ArcGIS system. Note that index and percentage variables cannot be used in this workflow.
Threshold 1 is set by default to 10,000. You can change it and add up to two more thresholds as you wish. In this case, we want to see areas around the locations that represent 25,000 people, so let’s enter that value in the Threshold 1 field. This threshold value represents the quantity of the variable the resulting threshold area will encompass (in this case, people). Imagine the areas growing out from each of your locations until an area comprising a value as close as possible to the threshold of your variable is reached.
In addition, you have the option to choose whether your threshold areas will be drive times or rings. Many people choose drive times since they want to find the threshold area based on their customers’ ability to drive to or from a location. In our case, we want to calculate drive times.
Adjusting the precision
You can also adjust the precision of the analysis by clicking on the Settings button and adjusting the slider. The higher the precision, the closer the areas will be to the desired threshold. Under the slider, you can click More options to adjust the target percent difference and increment size used in the calculation. These settings give you greater control over how close the workflow will get to the desired threshold. In this case, let’s leave the threshold settings slider at the balanced setting and the advanced options at their default values.

As with other drive time creation, you can make decisions about the type of area you want to create under the drive time’s More options link – e.g., the time of day (rush hour) or whether the drive time should be calculated to or from the location.
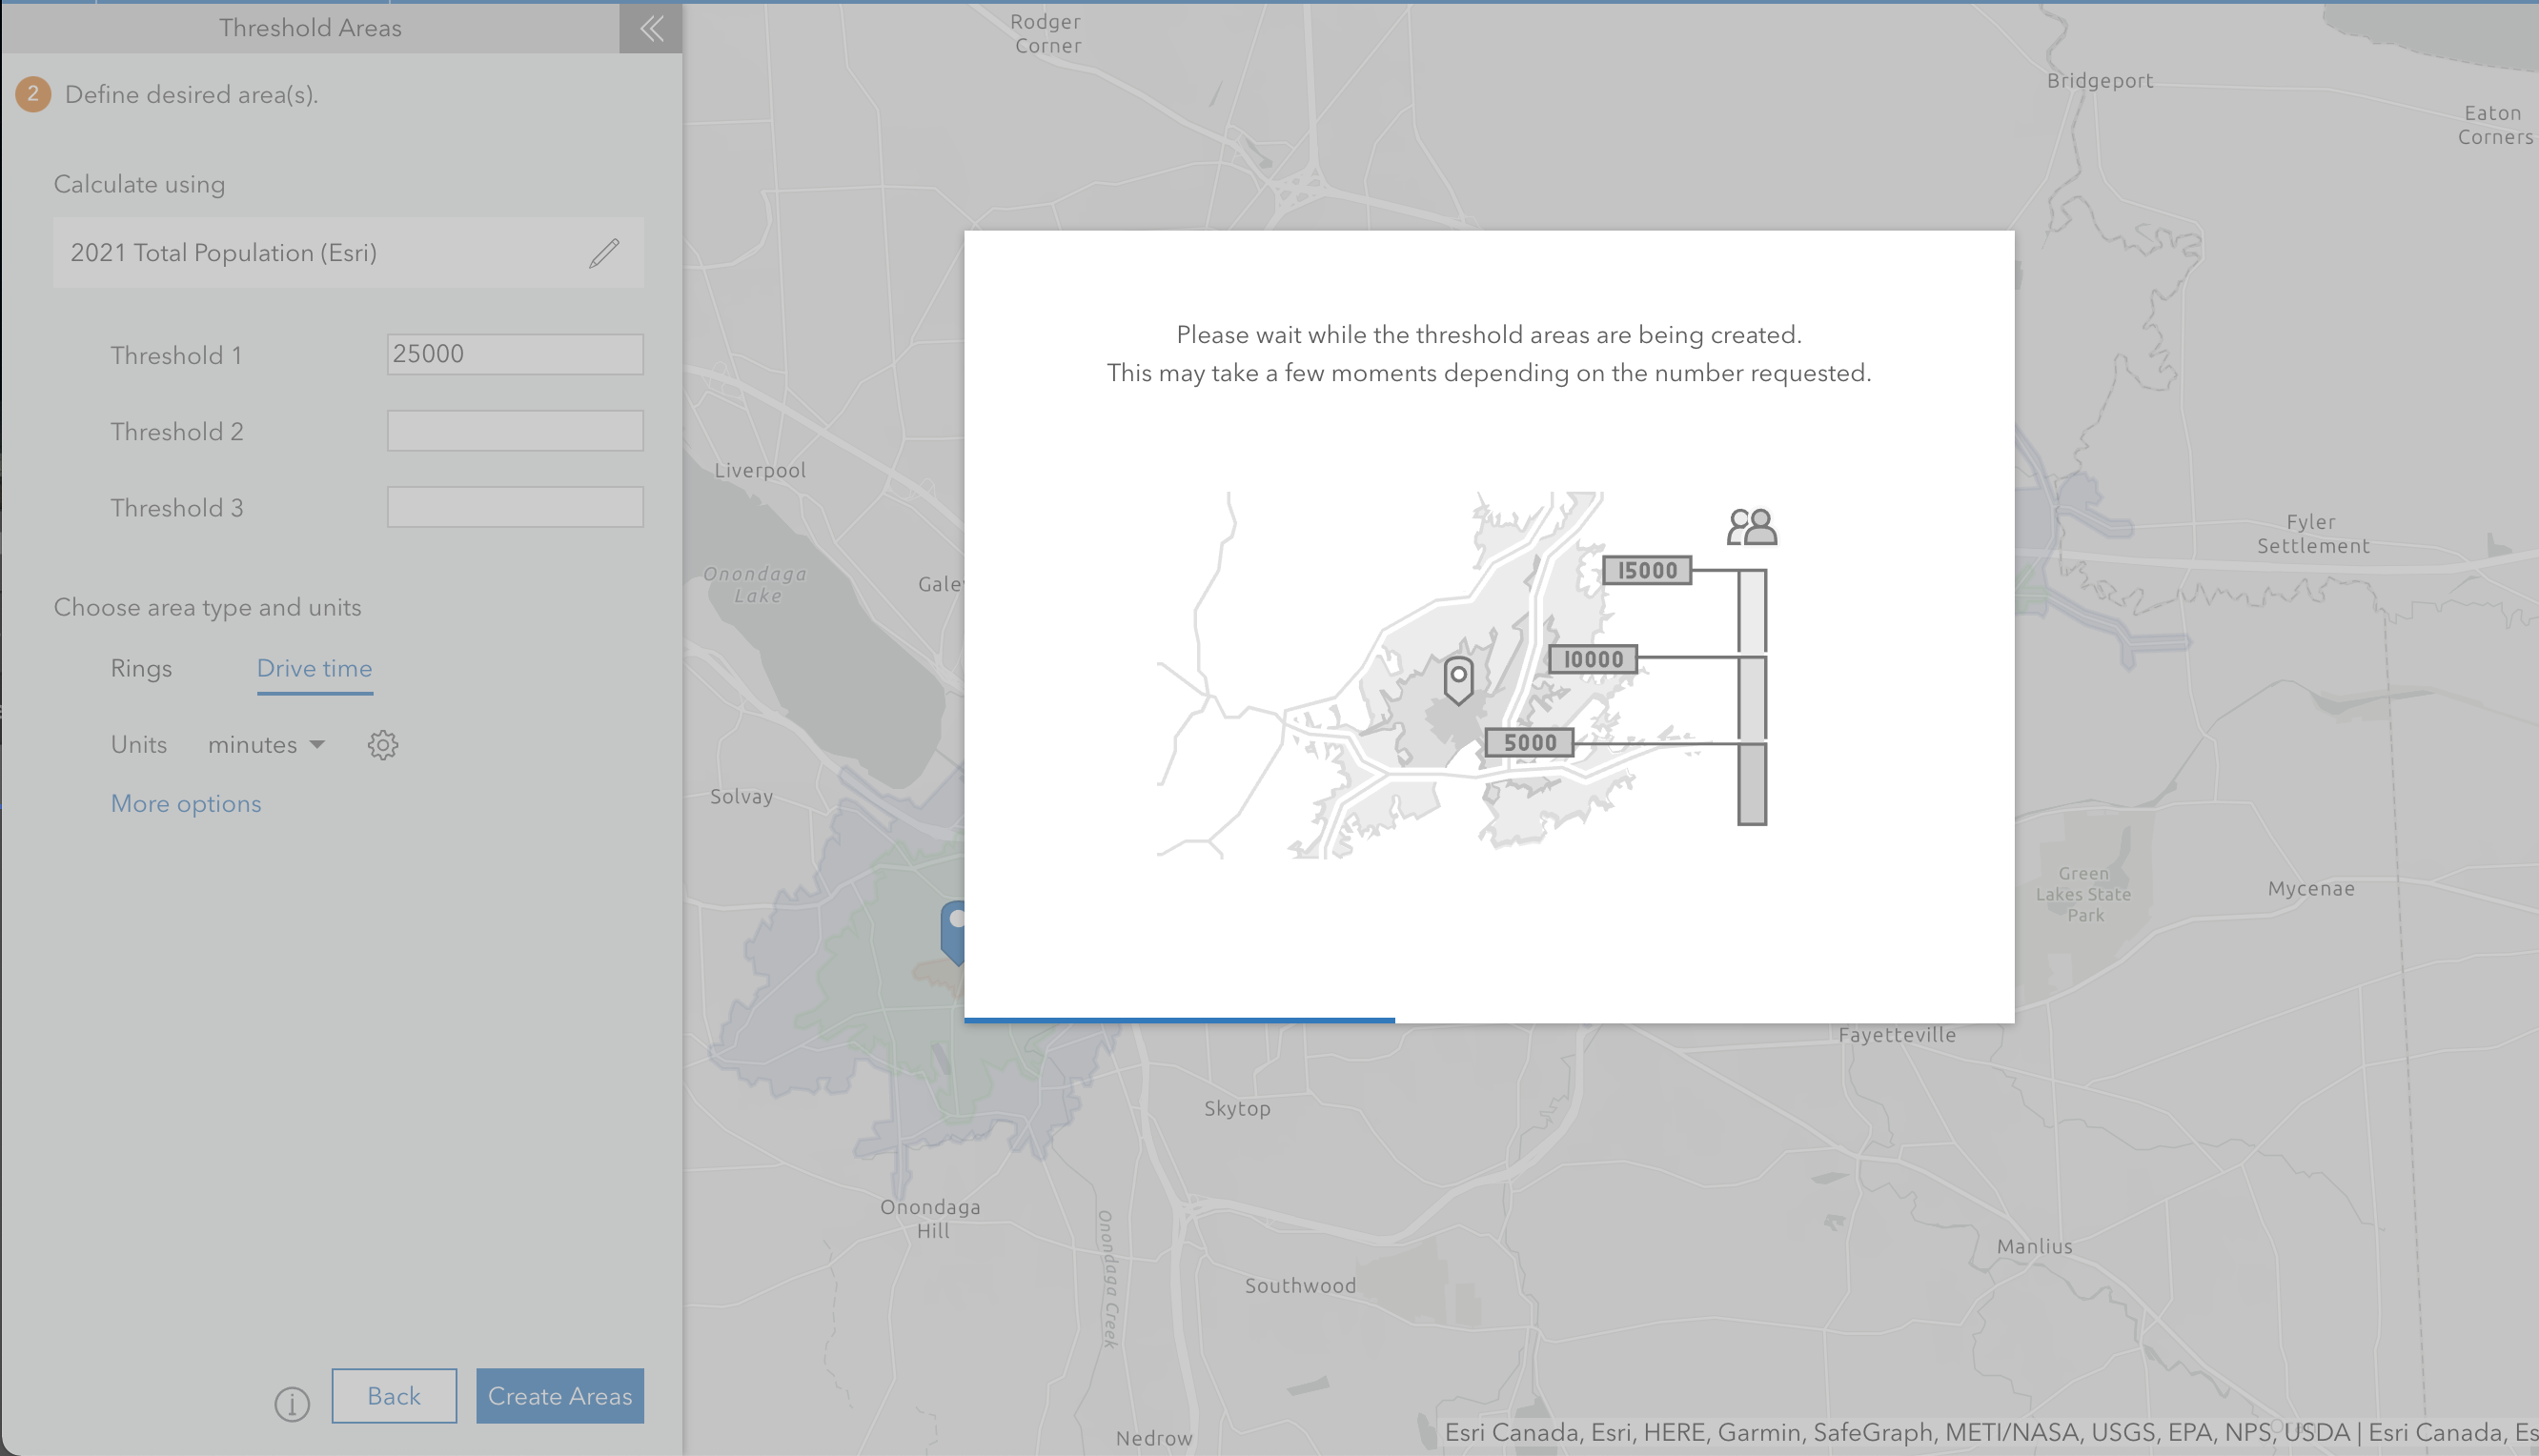
Once Step 3 is complete, click Create Areas. You may have to wait a few moments depending on the number, type, and precision of the threshold areas requested.
Understanding the results
Now let’s look at the results of the analysis. The newly derived threshold areas are visible on the map and the panel at left presents a summary of the results. At the very top you will see the total number of areas created and the variable used to create them. In this case, we created 2 threshold areas with the 2021 Total Population (Esri) variable.

You can see that the workflow got very close to the desired threshold of 25,000 people at a precision of 97.8%. Also, the threshold drive time created in the more urban area of Syracuse came in at 4.3 minutes, which is very close to our ideal drive time and thus looks like a great candidate for a new store. The other location, in a more rural area outside the city, shows that it would require at least an 8.1-minute drive to reach the same amount of people and is probably not as good a choice for the store. The average drive time for the two of them is 6.2 minutes.
When you are running threshold areas on more than two sites, these summary metrics will give you a quick view of the average, smallest, and largest areas. And if you are creating more than one threshold area for your locations, the summary page will include a drop-down menu to show the summary results for each threshold.
The full set of results for each location, including any additional attributes, is available in the table below the map. You can export this table as well as the summary information to Excel by clicking Export to Excel.
The final step in the workflow allows you to use the resulting threshold areas and get more information about them. Do you want to run infographics or reports on them? Or would you like to run another threshold analysis? You can choose your next step here or click I’m Done to move on to something else. The actual layer containing the threshold areas is saved automatically to a new folder in the Project panel called “Threshold Areas (Sites)” for further use.

We hope this article has been helpful and we are looking forward to hearing how you utilize this exciting new analysis tool!

Article Discussion: