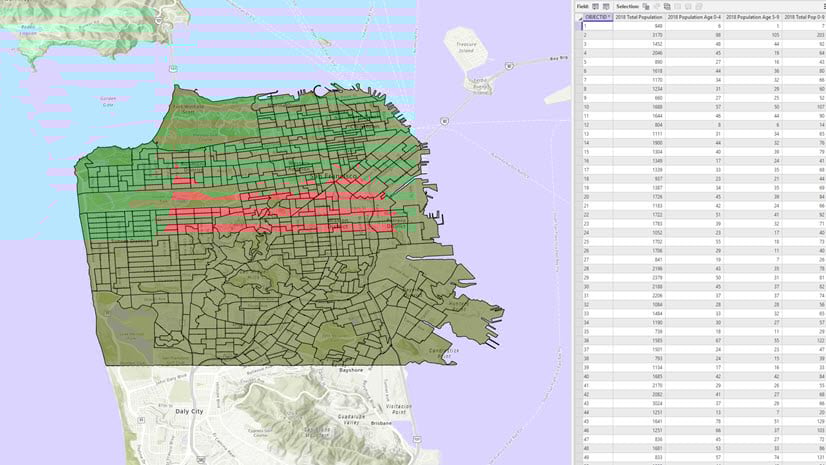
Creating and using custom data in Business Analyst can reveal spatial patterns that are difficult to detect in flat data formats. Once created, variables in a custom dataset—also known as a Statistical Data Collection—are seamlessly integrated into analytical workflows, including infographics, color-coded maps, and suitability analysis.

When you create a Statistical Data Collection, your variables are presented in the data browser, categorized to your specification. When you use a Statistical Data Collection, your variables are apportioned and formatted as you define.
This article answers common questions about Business Analyst custom data. The responses are intended to provide a high-level overview of how these custom datasets are created, how they work, and how they are used. You can use the following links to jump to different sections of the article:
- What is custom data?
- Can I create custom data in different Business Analyst products?
- Is there a difference between custom data created in Business Analyst Web App and Business Analyst Pro?
- What types of data/files can I set up as custom data in ArcGIS Pro?
- How do I create a Statistical Data Collection in ArcGIS Pro?
- How do I format variables in a Statistical Data Collection?
- How can I access custom data created in Business Analyst Web App?
- How can I access custom data created in Business Analyst Pro?
- Can I share custom data between Business Analyst products?
- How do I add an existing Statistical Data Collection to a new project?
- Can I add Esri standard data to a Statistical Data Collection?
- How do I use custom calculations in a Statistical Data Collection?
- Are there resources for learning more about custom data?
What is custom data?
Custom data are variables from an external source that are formatted for use in Business Analyst. Most organizations maintain proprietary records containing vital information about customers, revenue, and other key metrics essential for their operations. This is all that is needed to get started with custom data and Business Analyst.
Can I create custom data in different Business Analyst products?
Yes, you can create custom data in both Business Analyst Web App and the ArcGIS Pro Business Analyst extension (referred to as Business Analyst Pro in the rest of this article).
Is there a difference between custom data created in Business Analyst Web App and Business Analyst Pro?
Creating custom data in Business Analyst Web App and setting up a Statistical Data Collection (SDCX) in Business Analyst Pro share common objectives but vary in their processes, functionalities, and technical prerequisites. Both processes allow you to incorporate proprietary or third-party data for use in Business Analyst tools and workflows, but they cater to different environments and user needs.
Below is a comparison table highlighting the differences:
| Business Analyst Web App | Business Analyst Pro | |
|---|---|---|
| Environment | Browser-based (ArcGIS Online/Enterprise) | Desktop-based (ArcGIS Pro) |
| License requirement | Advanced license for creation; Standard license for access | Business Analyst Pro license + local dataset |
| Data input | ArcGIS layers, Excel, .csv, shapefiles | Polygon feature classes, BDS files |
| Workflow | User-friendly custom data setup available on Maps tab | Technical, using SDCX Editor or geoprocessing tools |
| Performance | Cloud-based, no user-controlled indexing | Local, with SDCX indexing for optimization |
| Use cases | Mapping, infographics, reports, basic analysis | Advanced geoprocessing, automation, complex calculations |
| Sharing | Easily shared via ArcGIS Online/Enterprise | Shareable, but loses standard Esri variable references |
| Technical skill | Minimal GIS knowledge is required | Advanced GIS knowledge is helpful |
Use Business Analyst Web App for creating custom data if you need a user-friendly, cloud-based solution for quick analyses, collaboration, and sharing across an organization, especially for users who are new to GIS.
Use Business Analyst Pro to create a statistical data collection if you require advanced GIS capabilities, local data processing, or complex workflows—for example, Python automation or custom apportionment layers—and have access to ArcGIS Pro and a local Business Analyst dataset.
What types of data/files can I set up as custom data in ArcGIS Pro?
Any polygon data in a spatial format supported by ArcGIS Pro can be used to create custom data. The data must contain IDs, numeric variables to be used in analytical workflows, and associated boundaries.
If you have data summarized by a geography, such as ZIP code or H3 hexagon, you can create the boundaries in Business Analyst Pro.
How do I create a Statistical Data Collection in ArcGIS Pro?
Statistical Data Collections extend a local Business Analyst dataset. Therefore, the first thing to do is set the Business Analyst data source to the local dataset that will be the source dataset of your Statistical Data Collection. You will only be able to access your Statistical Data Collection when the Business Analyst Data Source is set to the local dataset that was in use when you created your custom data.
Statistical Data Collections require an ID field, numeric data, and geographic boundaries in the source data.
If these elements are in place, you can click New Statistical Data Collection from the Business Analysis drop-down menu and select your input file. If your data does not contain boundaries, you can create them in ArcGIS Pro using tools such as the Generate Standard Geography Trade Areas tool. To create boundaries for your table using this tool, first add your table to ArcGIS Pro using the Add Data window.

Once you click OK, the table is added to ArcGIS Pro as a standalone table.

In this example, our custom data is summarized by ZIP codes, so we will next create ZIP code boundaries for each record in the table:
- Open the Generate Standard Geography Trade Areas tool. Set Geography Level to ZIP Code.
- Set Input Type to Table. Setting this value allows us to use the geography IDs in the custom data table to generate corresponding ZIP codes.
- Set Geography IDs Table to Mobile$.
- Set Geography Key Field to ZIP Code ID.

- Click Run.
Upon completion of processing, the boundaries are created and the custom data variables from your table are added to the attribute table. This completes setup of the input data.

The last step in the process is to create a new Statistical Data Collection. Click the Analysis tab, open the Business Analysis drop-down menu, and select New Statistical Data Collection.

The Create Statistical Data Collection window opens. Since the input file is loaded to the ArcGIS Pro map and Contents pane, we can select it from the Input Data drop-down menu and click Create.

The Statistical Data Collection is created, and the setup window opens.

Metadata is displayed about the source data, and a red exclamation point indicates that a performance index has not been created. Click the Build Index button to create the index and ensure optimal performance. The performance index should be rebuilt any time changes are made to the dataset.
How do I format variables in a Statistical Data Collection?
Statistical Data Collection formatting functionality is accessed by clicking Variables in the left pane of the setup window.

Here you can apply specific formatting, such as field type, precision, and output type, to your Statistical Data Collection Variables.
- Use the Summary Type drop-down menu to change the type to sum or average.
- Use the Apportionment Method drop-down menu to select the appropriate value. Apportionment methods are rates that exist in the apportionment layer attribute table. These rates are applied during analytical workflows such as Enrich Layer, to accurately estimate the percent of a known value that should be apportioned to a custom polygon. The rates are based on the quantity of the respective apportionment method variable assigned to a given apportionment layer point.
- Use the Field Format drop-down menu to change the format to count, percentage, or currency.
- Use the Precision field to define the number of decimal places to the right of the decimal point.
- The Category field allows you to assign specific names to folders containing your data in the data browser. You can organize your variables into multiple folders. If it is a variable from the data browser, the category is Default.
- The Alias field is the name of the variable in the data browser.
- The Vintage field displays the data vintage.
How can I access custom data created in the web app?
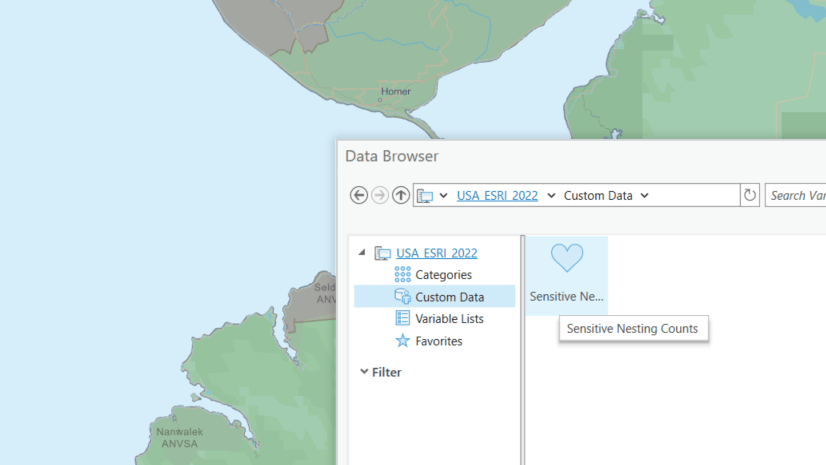
If you created the custom data in Business Analyst Web App, the Statistical Data Collection will be displayed under the Custom Data node of the data browser in ArcGIS Pro.

If someone else created the custom data in the web app and shared it with you, the Statistical Data Collection will be accessible from the Shared Content node in the data browser.

How can I access custom data created in Business Analyst Pro?
Custom data created in Business Analyst Pro with a local dataset is accessed from the Custom Data node of the data browser.

Can I share custom data between Business Analyst products?
Yes, you can share custom data between Business Analyst products. Statistical Data Collections created in ArcGIS Pro can be shared to your ArcGIS organization, then used in Business Analyst Web App.
To share a Statistical Data Collection in ArcGIS Pro, open the Catalog pane, expand the Statistical Data Collections folder, and then right-click the custom dataset item, and click Share from the contextual menu.

How do I add an existing Statistical Data Collection to a new project?
By default, Statistical Data Collections are accessible only in the project that they were created in.
To add an existing SDCX file to a new project, ensure that the data source is set to the local dataset used to create the custom data. Then, click the Analysis tab and then open the Business Analysis drop-down menu and click Add Statistical Data Collection.
Can I add Esri standard data to a Statistical Data Collection?
Yes, you can add Esri standard data to a Statistical Data Collection. Standard data are the Business Analyst variables provided by Esri. You can add these variables to, for example, create calculations between your data and the Esri standard data. Perhaps you want to create a calculation using your data and Esri data to return your customer percent penetration.
Although you can add standard variables to your Statistical Data Collection, you will not be able to share custom data that contains this type of data.
To add Esri standard data to a Statistical Data Collection, select Variables in the pane on the left and then click Add Variable.

The data browser opens, and standard data collections are presented for selection. Select the variables you are interested in and click OK.

How do I use custom calculations in a Statistical Data Collection?
Custom calculations allow you to create mathematic expressions on or between variables. For example, you may want to divide your Revenue custom data attribute by Customers to return avg revenue per customer. You can also create calculations using a mix of custom and standard Business Analyst data variables.
To add a calculation to your Statistical Data Collection, click the Add Calculation button from the Variables tab.

Are there resources for learning more about custom data in Business Analyst Pro?
To practice setting up and using custom data in Business Analyst, visit the following tutorials:
- Set up custom data for infographics in ArcGIS Pro
- Set up custom data for infographics (Business Analyst Web App)
To visit help documentation regarding custom data in Business Analyst, visit the following pages:
- Set up custom data (Business Analyst Pro)
- Import custom data parameters (Business Analyst Pro)
- Understand data apportionment (Business Analyst Pro)
- Set up custom data (Business Analyst Web App)
- Data apportionment reference (Business Analyst Web App)


Article Discussion: