The devastating Palisades fire ravaged over 23,000 acres of land and destroyed more than 6,000 structures, leaving a trail of destruction across Los Angeles County. For analysts tasked with assessing damage to residential neighborhoods, manually reviewing imagery to identify damaged or destroyed structures is a feasible approach, but also labor intensive and time-consuming. A more efficient approach is available through ArcGIS Excalibur, which now leverages raster analysis tools to streamline the process.

With the recent updates made to ArcGIS Excalibur, our team used the Raster Template tool to facilitate the inspection workflow, allowing us to run a collection of raster functions that accomplished this goal. ArcGIS Excalibur is a cloud-based app with easy-to-use tools and workflows for image and video analysis. The new Raster Templates tool in Excalibur supports the use of Raster Function Templates, which aims to streamline analytical workflows by chaining together raster functions, with the goal of producing a specific repeatable output. With these templates, users can apply consistent workflows across raster layers and projects, collaborate more effectively by sharing templates, and save time by repeating a built-in analysis process rather than starting from scratch.
Using the Raster Templates Tool in ArcGIS Excalibur
In this example, we began by running the Raster Template tool using a Raster Function Template to classify imagery that was taken prior to the Palisades wildfire. Three distinct categories were defined for classifying the data: Built Area, Vegetation, Dry or Barren Land. Once complete, the results for the classified layer were added to the map.

We ran the Raster Template tool again, this time using imagery that was collected after the wildfire. We also included another category within the classification, “Damaged or Destroyed Built Area”. The introduction of this new class allowed us to place buildings into damaged or undamaged categories.

Once complete, we ran a second Raster Function Template inside of the Raster Template tool, with the goal of extracting and visualizing only damaged or destroyed buildings from the classified imagery. To achieve this, we used the raster functions Compute Change and Attribute Table chained together inside of a Raster Function Template. After the Raster Tool was completed, the results were overlaid on the map with the damaged buildings identified in red.

Using Comparison and Observation Tools
To further the analysis, we used Excalibur’s Swipe tool to see the differences between the imagery from before and after the wildfire. We zoomed into an area of interest that primarily contained residential buildings and used the Swipe tool to confirm the damage that was detected by the Raster Template tool. The Swipe tool is one of the many comparison tools in Excalibur that enables users to easily perform change detection, automatically uncovering differences between two or more image layers.
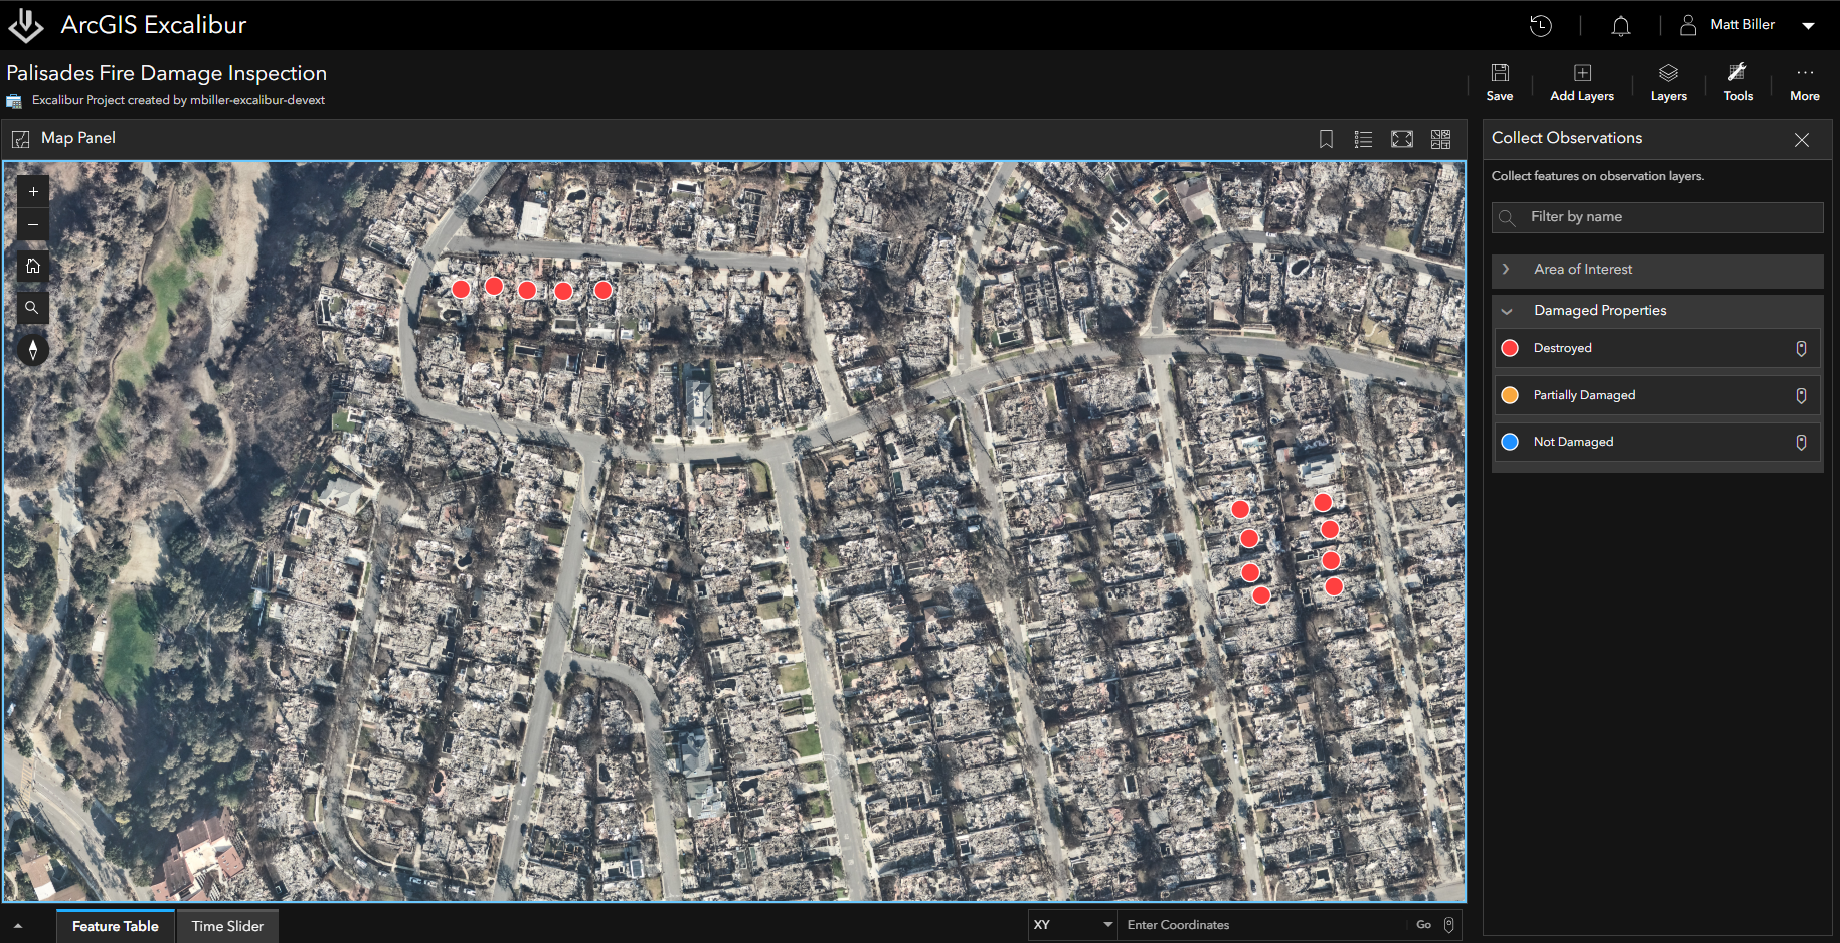
After verifying the damage to houses and structures, we used an Observation layer hosted by our organization to collect features on top of the imagery. Categorized into different levels of damage, we collected these observations on top of the houses in impacted areas, placing them into the categories of “Undamaged”, “Partially Damaged”, or “Destroyed”.
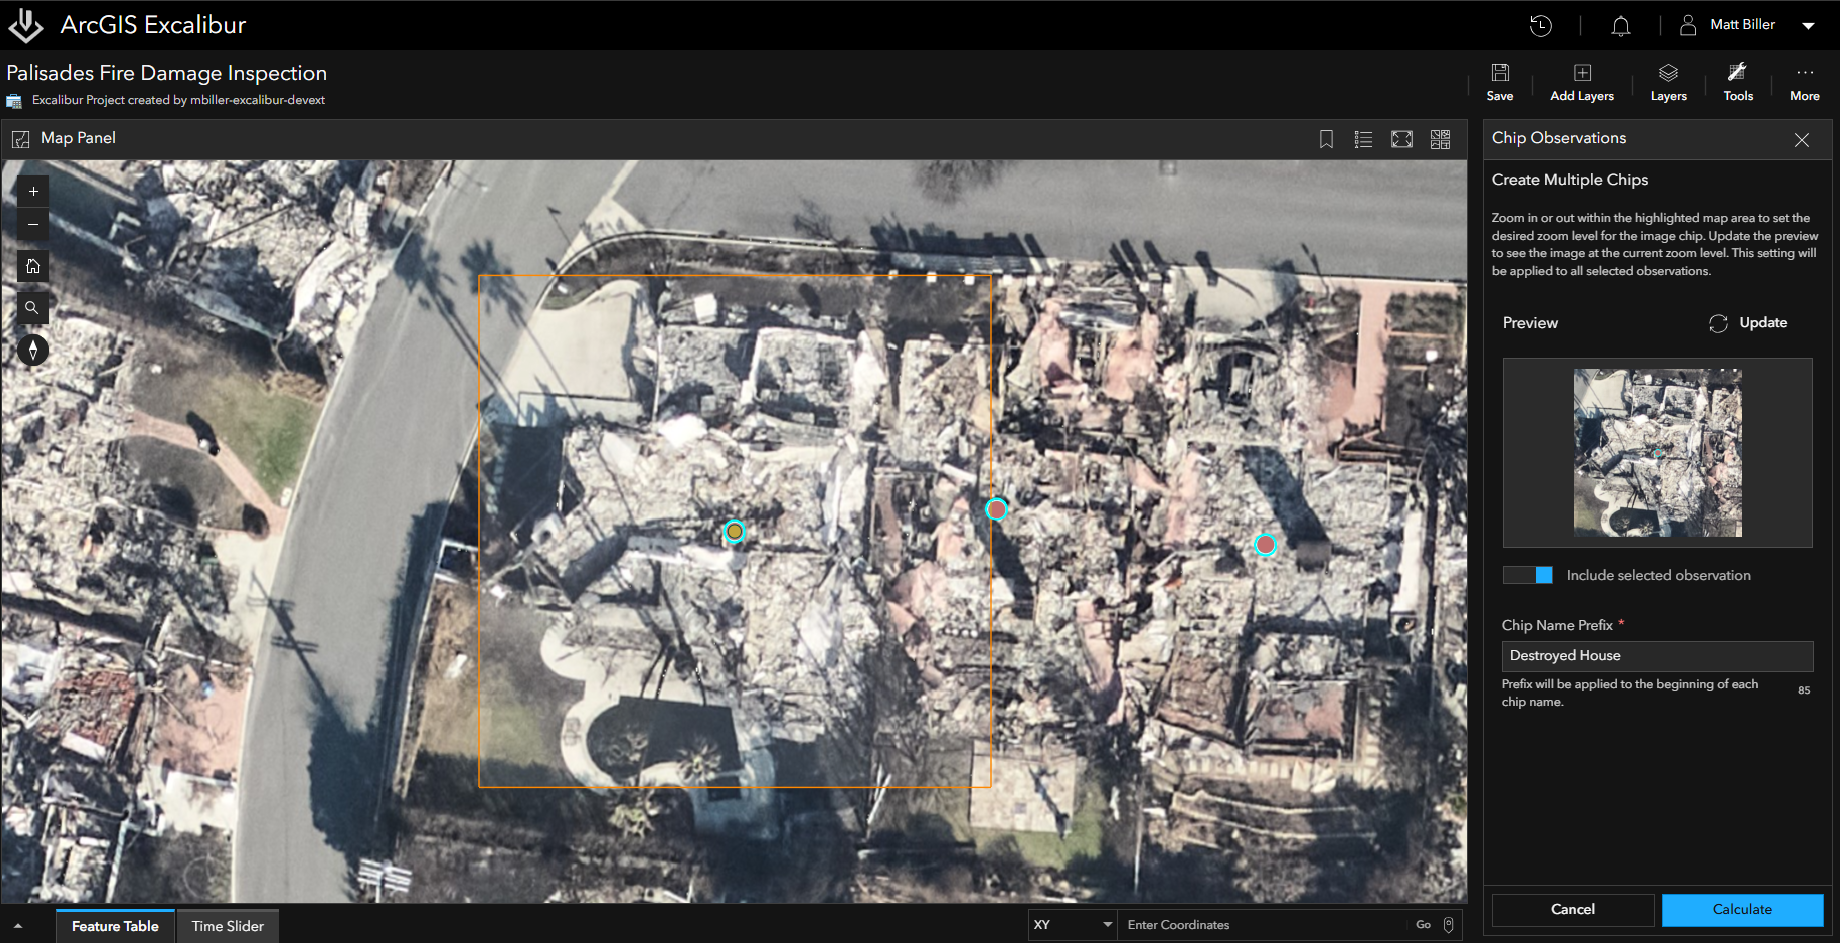
Finally, we created image chips using the Chips Observations tool, allowing us to attach image chips directly to each collected feature. These image chips can be referenced later by other users in the organization to view and continue assessing the damaged houses.
Sharing Results with the Attachment Viewer
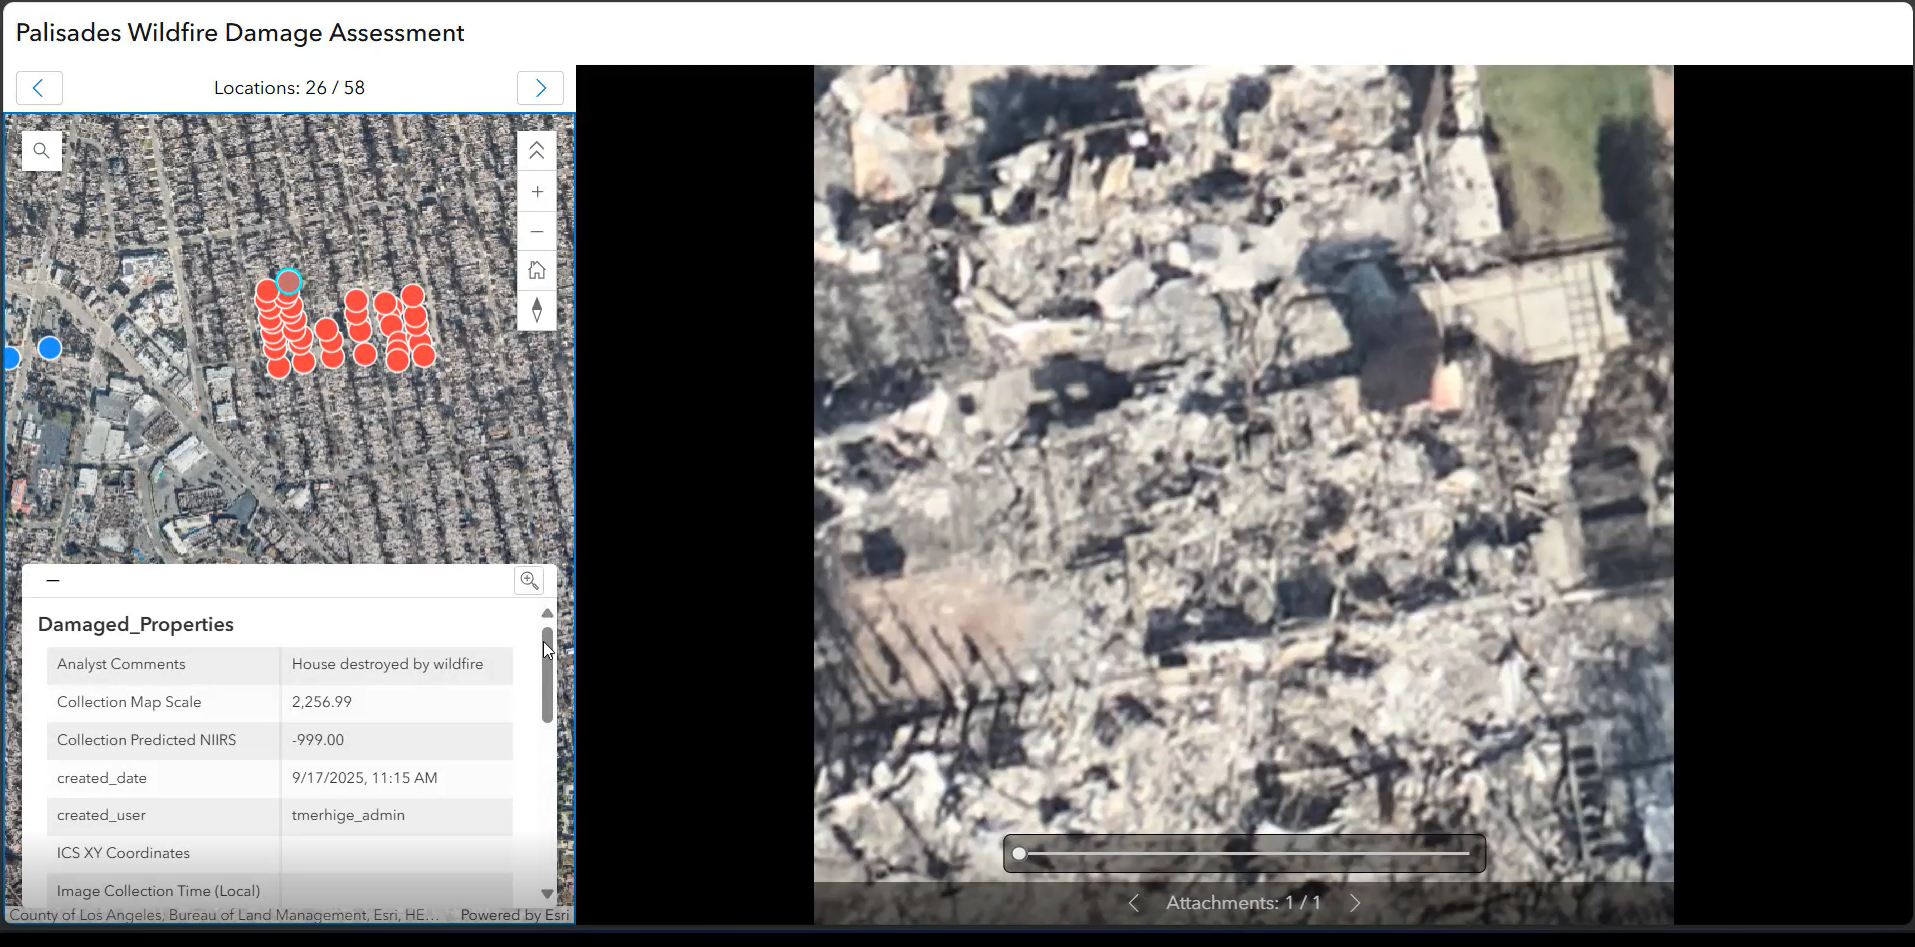
To summarize the findings and share the results with our team, we used the Attachment Report tool to export our analysis into the Attachment Viewer web application. The Attachment Viewer streamlines collaboration by allowing us to create a shared report where other members in the organization could browse and review the image chips collected during our analysis.
Boosting Productivity on Damage Assessments
With just a few steps, we leveraged Excalibur’s tools to classify and compare imagery of damaged houses, categorize the damage detected in that imagery, and export and share findings. The results of this analysis can then be used further to prioritize where resources are allocated, factor into insurance claims, or help mitigate future disasters in the area. By using repeatable workflows with raster function templates, analysts can perform damage assessments more efficiently, overcoming manual processes that are time-consuming and prone to error.
To learn more about ArcGIS Excalibur, visit the website or engage with experts on Esri Community. Find out what else in new with Excalibur Documentation.


Article Discussion: