This article highlights a Mars mission tracking app from the Experience Builder gallery. In my next article, I’ll show you how to re-create its in-app tutorial.
Mars 2020 Mission Tracker
JEZERO CRATER, MARS – In February, the rover Perseverance and the small robotic helicopter Ingenuity celebrated two years together exploring the red planet. The robot duo, supported by hundreds of engineers, scientists, and experts from NASA’s Jet Propulsion Laboratory, are part of Mars 2020, a NASA mission searching for signs of ancient Martian life. The robots launched in a rocket from Cape Canaveral, Florida on July 30, 2020 and landed on Mars on February 18, 2021. They’ve spent the past two years looking for signs of past microbial life, collecting rock and soil samples, and successfully conducting the first powered, controlled flights on another world.
You can check in on the robot pair right now with the Mars 2020 Mission Tracker. The app, made by Bruno Sousa of the Spatial Studies Lab at Rice University, is built using ArcGIS Experience Builder.
To learn more about Experience Builder, visit Try ArcGIS Experience Builder for explanatory videos and walkthrough tutorials.
Sousa pulled from official mosaics, terrain models, flight paths, and more to create the rover tracking app. You can view Perseverance’s pictures of the Martian surface, track Ingenuity’s flight paths, and see each robot’s current location.

You can also use the time slider, a custom widget made by Rice’s Wilson Franca, to view every sol of their journey. Here are some mission milestones to look for:
- Sol 0 (February 18, 2021) – The robots land on Mars.
- Sol 14 (March 4, 2021) – Perseverance’s first drive.
- Sol 59 (April 19, 2021) – Ingenuity’s first flight.
- Sol 427 (May 2, 2022) – Perseverance loses contact with Ingenuity after its 27th flight. NASA puts all scientific activities on hold to search for the helicopter.
- Sol 429 (May 4, 2022) – Perseverance and Ingenuity reunite.
Measure tool tutorial
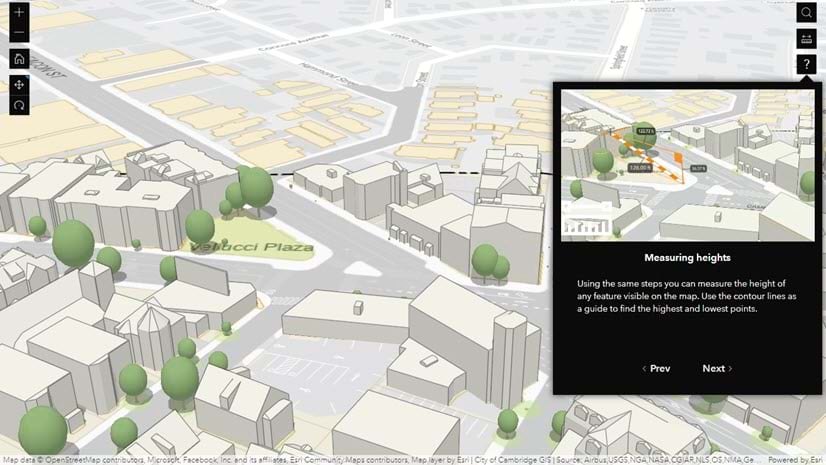
There are a lot of great things about this app worth considering for your Experience Builder projects. One is the tutorial window that Sousa added to the map’s default measure tool.

The tutorial is a step up from the standard instructions that appear when you open the measure tool. The GIFs show you how to use the tool in the context of the app, and demonstrate clear questions you can use it to answer (How far apart are the robots? How tall is that ridge?) The Esri icons make the tutorial look even more official.
The tutorial uses five kinds of Experience Builder widgets:
- A Button widget
- A Section widget with four views
- A Views Navigation widget for cycling through the views
- Image widgets with GIFs and Esri icons
- Text widgets with titles and instructions
Here is a screenshot showing what you might call the tutorial’s widget anatomy:

The use of a 32×32 pixel button is a clever way of making the tutorial blend in with the measure tool. The measure tool is a part of the Map widget. The button is not, but it looks and behaves like it is. It has the same dimensions and colors, shows a tooltip, and the icon changes color when the pointer hovers over it.
Exercise: Make an in-app tutorial
In my next post, I’ll show you how to make a similar tutorial in the out-of-the-box version of Experience Builder.
More information
You can find this and other web applications in the Experience Builder gallery. To learn more about Bruno Sousa’s work, visit spatialstudieslab.rice.edu.
For more information about Experience Builder, see the following resources:
- Try ArcGIS Experience Builder
- ArcGIS Experience Builder help: What’s new
- ArcGIS Experience Builder overview and concepts
The banner image of Perseverance is by NASA/JPL-Caltech/MSSS and shared on Wikimedia Commons as part of the public domain.


Article Discussion: