GeoAnalytics Server powers big data analytics within ArcGIS Enterprise. At the 10.7 release, we have expanded GeoAnalytics to include new tools, new possibilities for developers, and new opportunities for data – all of this in one of the biggest releases yet!
This blog will focus on the following new features:
- Describe Dataset: a new tool to help you understand your data.
- Generalized Linear Regression and Forest-Based Classification and Regression: two new tools to see relationships and make predictions in your data.
- Run Python Script: a new extensibility option to run custom python scripts on your GeoAnalytics Server and chain tools together to complete powerful distributed analyses.
- Write analysis results to external data stores: the ability to keep your data in one place by writing your analysis results to your data sources (big data file shares).
We have also taken some popular GIS tools and developed them to work with larger datasets, as requested by our user community. These tools include Clip Layer, Dissolve Boundaries and Merge Layers. It’s very common to use GeoAnalytics to simply manage your data better – to clip it down to a subset, or to merge layers together, or to dissolve boundaries between polygons. You can now do all of this, in addition to using the existing data management tools released in previous versions.
Let’s look at what’s new! The GeoAnalytics team will be writing blogs that go into more detail on these enhancements – as well as others – so be sure to keep an eye on the blog site for those.
Describe Dataset
Say I’m an Energy Analyst and my team lead has registered a large dataset of energy consumption so that I can analyze it using GeoAnalytics. She has given me access to the dataset as a big data file share, but I haven’t ever seen the source data. Rather than running random analysis – or copying the data – to try and figure out what’s in it, I can now run Describe Dataset to get a comprehensive view of what my data entails.
With Describe Dataset, I can find out:
- Where the layer is stored (big data file share or ArcGIS Data Store)
- How many records are in my dataset
- The geometry settings (point, line, polygon or table) as well as the spatial reference, spatial extent and number of features with or without a valid geometry
- The time type (instant, interval or none) as well as the number of features with and without a valid time
- A sample of the data, including the attributes, geometry and time.
- The extent of the data in space (based on the minimum bounding rectangle) and time (start + end)
This is a great tool to run if you are first getting familiar with your data, or if you know that your source data is changing or accumulating and you want to get the most recent status. It’s also a good tool to determine if your data has missing values, if your big data file share is registered correctly, or to run analysis on if you want to quickly prototype your workflow. Insider tip: It’s a good one to use to test that GeoAnalytics Server is up, running, and healthy.

Tool parameters for Describe Dataset.
Generalized Linear Regression and Forest-Based Classification and Regression
By popular demand, regression has made its way to GeoAnalytics! If you are familiar with the Forest-Based Classification and Regression tool in Pro, we now have a tool that can do the same analysis against big data.
As a Marine Biologist, I may want to be able to predict future occurrences of seagrass (also known as marine plants!) across all oceans. I could use this Forest-Based tool to input multiple different environmental variables (light, pollutants, storms) as well as proximity to factories and ports to see if it is likely or unlikely that seagrasses will grow in certain areas – and what factors may have contributed to declining occurrences of seagrass. Forest-Based Classification and Regression can be used in two ways – one, to train a model, and two, to fit a model and predict values.
The second regression tool we have added is Generalized Linear Regression. This tool generates linear models to find relationships (such as: an increase in X leads to higher Y values) and predict to new datasets (knowing this relationship, what are predicted values on new inputs?). With this tool you can find relationships for continuous data, binary data (like will an event happen or not), and count data.

Tool parameters for Generalized Linear Regression.
For both of these tools, in addition to using your data, you can calculate new attributes based on location that can be used in analysis. For example, you can calculate the distance to the nearest hospital, the number of hospitals within a 10 mile radius, or summary statistics on near or intersecting features. This can be completed by using Build Multi-Variable Grid, and then enriching your data based on spatial location using Enrich from Multi-Variable Grid. This allows you to calculate an almost limitless number of attributes that can help you predict, find relationships, and solve your geospatial problems.

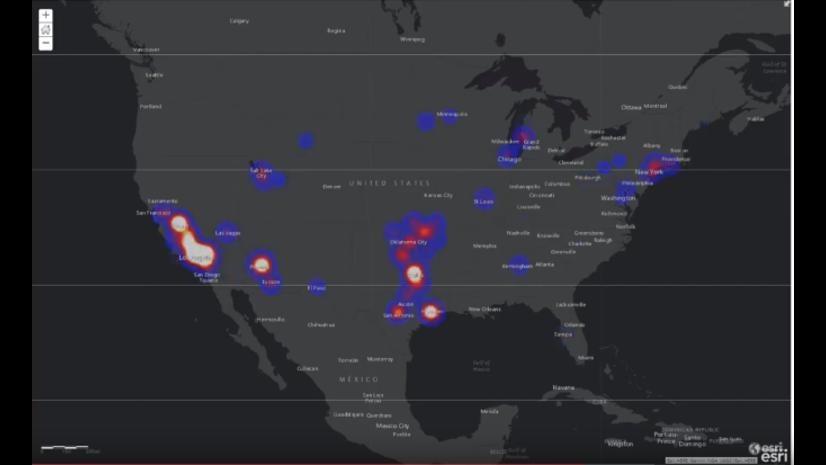
Example of predicting occurences of 911 calls on a dataset using these new tools.
Run Python Script
GeoAnalytics Server brings a powerful, distributed computing platform to your GIS. A lot of power users and developers have wanted to be able to use that platform to write their own custom code. At 10.7, now you can.
Run Python Script allows you to execute PySpark code against GeoAnalytics. You can use all subpackages of PySpark to implement machine learning, or to even simply run SQL queries against your data.
Run Python Script also allows you to chain multiple GeoAnalytics tools together without creating an intermediate layer. So, instead of running Join Features, then taking my result and running Aggregate Points on it, I can chain these two tools together and have one output result. Saves space and time – both things we love in GeoAnalytics!
Write results to input sources
A common request we have heard from customers is that they have their data in an external store – such as an Amazon S3 bucket or HDFS – and, though they like being able to connect to these stores to use them as input, they also want to write their analysis results back to these stores. We know that all analysis workflows involve more than just you as the Analyst – maybe you’re sending your results off to your manager or the engineering department and they are familiar with accessing data in certain stores.
Before 10.7, all analysis results were returned as hosted feature layers in ArcGIS Enterprise. Now, at 10.7, if I have 50 CSVs in an Amazon S3 bucket, and I want to run Summarize Within (or any other tool) on that data, I can write my results back to S3, so other colleges can use my data outside of ArcGIS. Writing your results as web layers isn’t going away – but we’ve just introduced a new option for those that prefer keeping their data in one place.
To learn about writing back to big data file shares, check out this help topic: Output templates in a big data file share. You can choose both where you want to write your results, as well as what format you want to use (shapefile, delimited file, Parquet or ORC). For a visual representation of data inputs and outputs, check out the Following the flow of data in GeoAnalytics Server blog.
We look forward to hearing how you use these new features in GeoAnalytics! To get in touch with the team, feel free to contact GeoAnalytics@esri.com.
Sarah & Hilary


Article Discussion: