One location can tell more than one story. The ArcGIS Instant Apps Indicator template provides a streamlined way to explore multiple indicators from a single, large dataset in one interactive app. A single dataset might contain population, income, employment, health outcomes, environmental measures, or dozens of other indicators for the same geographic areas. Exploring those variables on a map can provide valuable context, but creating and stylizing separate web maps for every indicator can quickly become time-consuming and difficult to maintain.
The Instant Apps Indicator template reads your data as it’s stored in the layer. You don’t need to reshape, pivot, or copy your layer to use the template or stylize the different values in the feature layer.
How does Indicator work?
Indicator is built around answering a single question: How does this measure vary for the same geographic areas?
Rather than navigating between multiple maps, viewers explore your different measures through a simple set of filters:
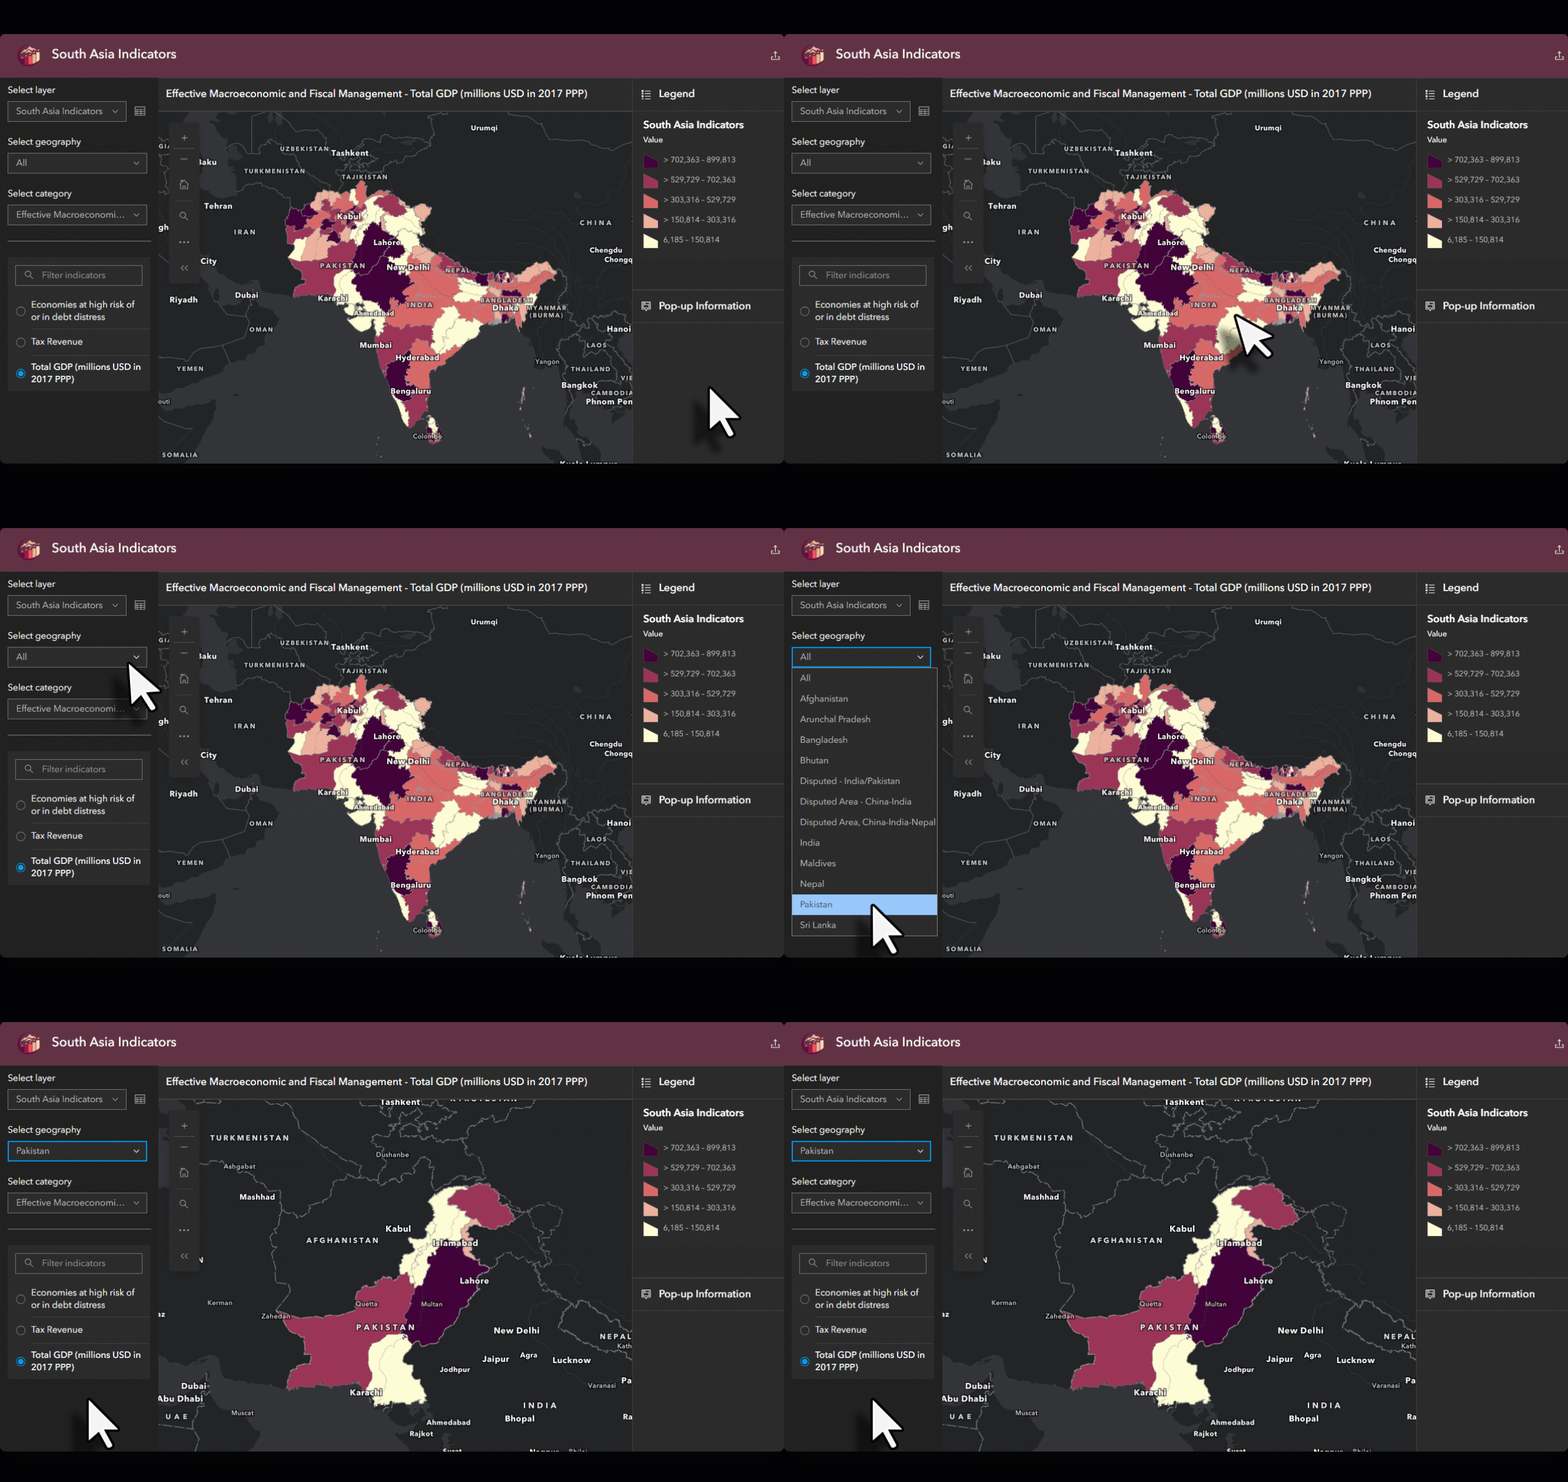
- Geography: Focus the map on a specific area, such as a single country, state, or region.
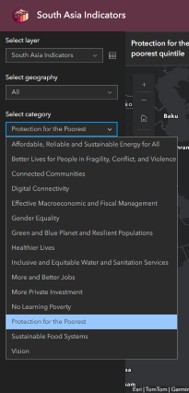
- Category: Narrow a long list of indicators down to a theme, such as health outcomes or economy.
- Indicator: Choose what to map. Viewers see readable indicator names, not a list of attribute fields.
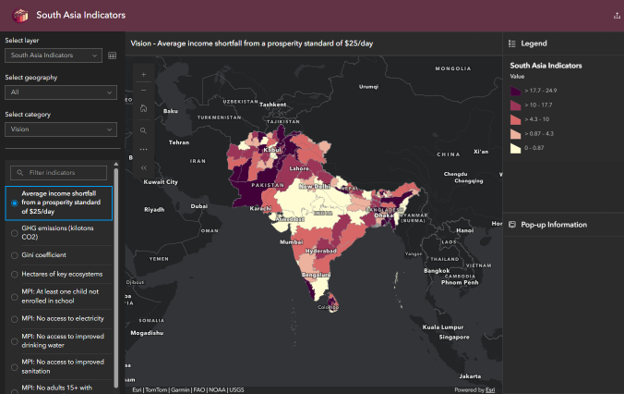
If your data spans multiple days, months, or years, viewers can also step through time to see how an indicator changes. And when they want details about a specific place, they can click it to open the pop-up you configured on your layer.
Bring your data as it is: tall or wide
Don’t know if your data is tall or wide? We will help you decide. Indicator data is usually stored in one of two data schema, and Indicator supports both. You don’t need to reshape your data to fit the app.
Wide data stores one row per place and one column per indicator. Adding an indicator means adding a field or value per place. In the following example table, the county column indicates the geography fields, the column headings are indicator names, and the data entries listed below the indicators are the numeric values of the indicators. In this example, the indicator data is stored by county.
| County | Median income ($) | Uninsured (%) | Unemployment (%) |
|---|---|---|---|
| County A | 61,200 | 9.8 | 4.1 |
| County B | 54,700 | 12.3 | 5.6 |
Tall data stores one row per place per indicator. The column data contains the various indicators, a separate column holds corresponding values, and an optional column identifies categories for the indicators. Many statistical agencies and open data portals publish data this way because new indicators can be added as rows without changing the schema. In the following example table, each indicator name is stored in a column as is the indicator value. Therefore, multiple row entries will exist for each geography. In this example, each county has multiple entries (one per indicator).
| County | Category | Indicator | Value |
|---|---|---|---|
| County A | Economy | Median income ($) | 61,200 |
| County A | Health | Uninsured (%) | 9.8 |
| County A | Economy | Unemployment (%) | 4.1 |
| County B | Economy | Median income ($) | 54,700 |
Sample data for illustration only. The tall table shows its first four rows.
The two tables above contain the same information. The difference is how it’s organized, and that difference changes how the app configuration reads the data, letting your users work with it accordingly.
Schema detection
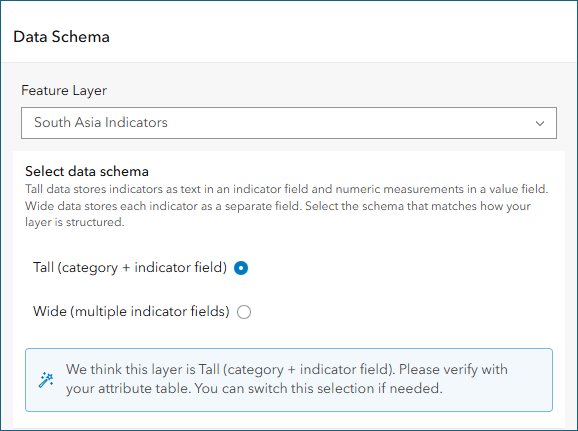
When you select your layer during configuration, Indicator looks at its structure and automatically selects the schema it thinks your data uses. It considers how many numeric fields the layer has and whether field names suggest an indicator and value pair. A preview table shows what each schema looks like so you can compare it with your own data.
Indicator’s detection capabilities do most of the work, but you know your data best. The configuration prompts you to confirm the choice before moving on.
Is Indicator right for your data?
Indicator works best when you want to explore multiple measures across geographic areas without creating a separate map for each one. The type of comparison you want to make can help determine the best styling approach.
- Compare geographic patterns: Use dynamic classification to recalculate class breaks for each indicator. This helps reveal relative high and low values, even when indicators have different units or ranges. Keep in mind that the same color will likely represent different numeric values across indicators.
- Compare values using a consistent scale: Use manual classification to keep class breaks fixed across indicators. This is useful when values share the same units and you want colors to represent equivalent numeric ranges.
Choosing the right approach depends on your data and what you want viewers to understand from it.
Configure your Indicator app
Indicator follows the same configuration patterns as other Instant Apps templates, and Express setup keeps you focused on the settings you need for a working app. Setting it up takes minutes.
- Choose the map that contains your indicator layer.
From Map Viewer, click Create app > Instant Apps and choose Indicator from the home page. - Select the layer that contains indicator data and confirm the schema in the configuration.
- Verify the selection against the preview and confirm.
- Identify the following data in your layer:
- Geography–This is the column that names your places.
- Indicator–For wide data, select the indicator fields you want to allow the app users to explore. For tall data, select the single column that holds indicator names.
- Value–For tall data, select the numeric field that holds each indicator’s value.
- Category (optional)–For tall data, this is the column that groups indicators into themes.
- Choose classification and style.
Pick a color ramp, a classification method, and the number of classes. These settings define how every indicator will be drawn.
While you select style settings, a histogram shows how your indicator’s values are distributed across places. Drag the slider to highlight the places within a range of values, especially if you choose to go with themes for unclassed numeric data on a continuous scale. - Like other Instant Apps templates, you can pick the map extent (by configuring the map area), pick the basemap with the basemap gallery, add a cover page and introduction window, configure the language switcher, and apply theming to match your organization’s other apps. For a complete list of options, turn off express setup.
- Publish your app and share it with audiences.
Use case: development indicators across South Asia
Let’s walk through a fictional example. Say your organization tracks development indicators for South Asia at the subnational level. The dataset covers hundreds of indicators across categories such as Vision, Green and Blue Planet and Resilient Populations, and Effective Macroeconomic and Fiscal Management. Your dataset is stored as a tall table with one row per region, indicator, and year.
Without Indicator, sharing this data could mean dozens of maps, each with its own rendering and legend, and a gallery page to tie them together. Every update means touching each map.
With Indicator, all of that data can be contained in one app. A viewer interested in Bangladesh selects it from the Geography drop-down menu, picks Green and Blue Planet and Resilient Populations as the category, and chooses an indicator. The map zooms to Bangladesh and draws the indicator for each region, with a legend built for that indicator’s range.
Next, they switch to an indicator in the Effective Macroeconomic and Fiscal Management category. The values now sit on a completely different scale, so the app recalculates the class breaks and updates the legend. If the indicator has data for several years, they step back in time using the time slider to see how the regions have changed. When one region stands out, they click it to read its details in the pop-up.
One app, every indicator
Instead of dozens of maps to build and maintain, you publish one app that adapts to whichever indicator a viewer picks. When your data updates, the app updates with it.
Try Indicator with your own data and share your experience on the ArcGIS Instant Apps Esri Community page. For more on getting started, see the Indicator documentation. We’re looking forward to seeing what you build!


Article Discussion: