Note: Next year, we are moving to semantic versioning to enable more clarity, predictability, and better tooling support. The next release will be 5.0.0.
This release of ArcGIS Maps SDK for JavaScript is packed with updates, from new 3D visualization capabilities to editing workflows to deeper adoption of web component standards. Read on to learn about some of the highlights in version 4.34!
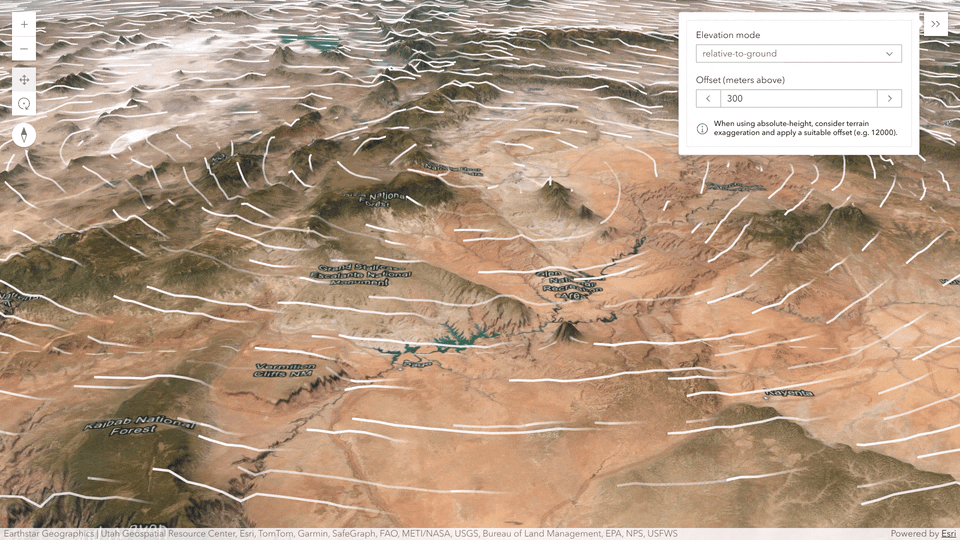
Flow rendering in 3D
Create animated visualizations in 3D of directional raster data (Vector-UV or Vector-MagDir) using the Flow Renderer with your imagery tile layers and imagery layers. You can configure the positioning of the flow lines relative to sea level or the terrain. For example, to visualize how wind interacts with the topography, you can display the lines draped on the ground with an offset.
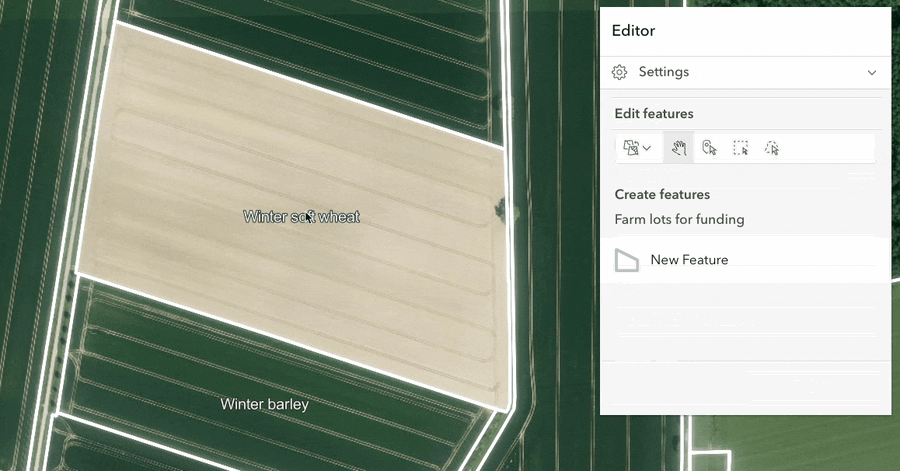
Edit with split and merge
Split and merge workflows were added to the editor component.
Split: The split workflow allows users to divide selected lines, polygons, or multipoint features into multiple new features. After performing a split, you can review the resulting features and their attributes before committing the changes.
Merge: The merge workflow enables users to combine multiple features into a single feature. For polygons, adjacent features will merge into one bigger feature, while non-adjacent features will merge into one multipart polygon. Users can select which feature’s attributes to preserve during the merging process.
The split and merge tools are particularly useful for streamlining parcel modification, farm boundary alterations, and forestry treatment updates.
Build apps using components
Haven’t moved to components yet? We recommend migrating your apps to use the map, scene and other components that replace widgets. See Esri’s move to web components for details about the transition period and future, and the migrating to components guide page for migration tips.
Components are advancing! We have implemented slots and shadow DOM in our Map components for improved encapsulation and flexibility.
Slots: Slots are a core concept in web components. Think of them as predefined placeholders that let you easily integrate your own content by referencing the slot’s name. With this release, the map and scene components now include a collection of slots. Use these to place components and other UI elements on top of the map or scene. This new pattern replaces the deprecated position attribute and the placement component.
If you need to manually position an element, you can simply use CSS directly, and no slot is required.
<body class="calcite-mode-dark">
    <arcgis-map item-id="237b9584339446a0b56317b5962a4971">
        <arcgis-zoom slot="top-left"></arcgis-zoom>
        <arcgis-legend slot="bottom-right"></arcgis-legend>
        <calcite-button slot="top-right">Click me!</calcite-button>
    </arcgis-map>
</body>
Shadow DOM: All map components now have a Shadow DOM. This is another common aspect of web components. It encapsulates custom elements, which keep their markup structure, style, and behavior hidden and separate from other code on the page. This preserves the component’s internal design but also prevents developers from styling the component’s internal elements with standard global CSS selectors. To customize the style, you can use the documented design tokens and component css variables to style components.
Modes: Light and dark themes can be configured via Calcite modes.
Layout CSS variables: The map, scene, link chart, and video components now provide the following CSS variables that reserve space around their content to prevent overlaying UI elements (like toolbars, legends, or panels) from obscuring slotted components.
--arcgis-layout-overlay-space-top
--arcgis-layout-overlay-space-right
--arcgis-layout-overlay-space-bottom
--arcgis-layout-overlay-space-left
Loading the SDK’s styles: This update also (in most cases) removes the need to include a link to the core CSS stylesheet since styles are already encapsulated inside components. For more details and caveats, see “Changes to core stylesheet usage” in the release notes.
Learn more by visiting the Building your UI guide page.
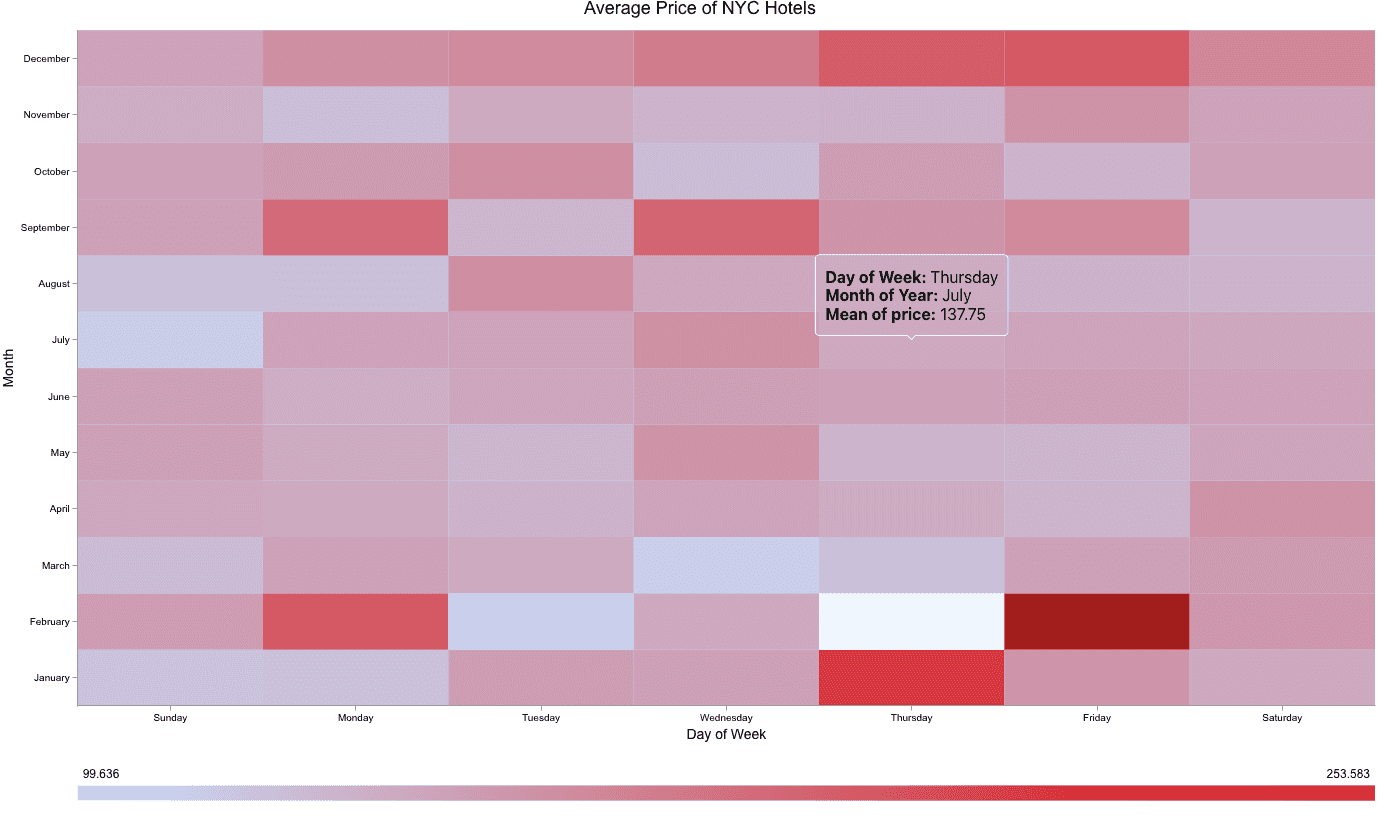
Charts: simplified code and a new heat chart!
Charts components (now out of beta!) are used to visualize data in a graphical format, making it easier to identify patterns, trends, and insights.
Declaratively load charts: You can now create charts in your app simply by configuring the component in HTML to point to a chart saved in a feature layer item. This is achieved by setting the layer-item-id attribute (for the layer you’re working with) and chart-index attribute (to access the chart you want to display).
<arcgis-chart layer-item-id="8871626e970a4f3e9d6113ec63a92f2f" chart-index="0">
</arcgis-chart>
Heat chart: The new heat chart allows you to configure data in a matrix form to uncover patterns, relationships, and trends across large datasets. It can group data by two date fields (such as month and day), two categorical fields (such as product type and region), or a combination of one date and one categorical field (such as monthly energy consumption by appliance type).
Learn more in the create a heat chart tutorial.
Consistent layer-level field formatting
Easily configure field formatting directly within feature layers, such as aliases and date and number field formatting, to enable consistent formatting within SDK components such as popup and feature table. This new capability also adds new formatting options that better align with internationalization standards, allowing you to control how fields are displayed across locales and time zones.
Note: FieldConfiguration is the recommended approach for managing field settings for all feature service-based feature layers and tables (with plans to expand to additional layer types in future releases). Existing applications using FieldInfo will continue to work. For more details, please refer to the FieldConfiguration documentation.
New popup component (beta)
The new Popup component provides a declarative way to display and manage popups in view components (map, scene, and link charts). To use the popup component with a view component, simply add it as a child element and assign it to the popup slot.
<arcgis-map item-id="237b9584339446a0b56317b5962a4971">
    <arcgis-popup slot="popup"></arcgis-popup>
</arcgis-map>
For more information on how to use the Popup component, see the Popup component reference.
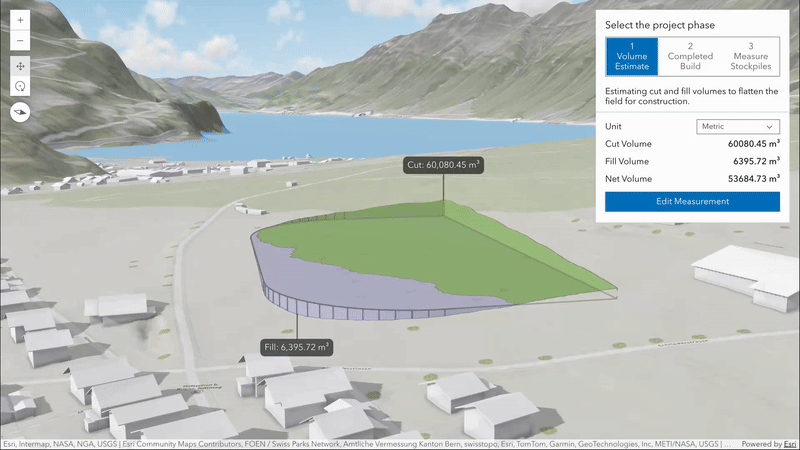
New volume measurement analysis (beta)
Volume measurement analysis lets you interactively measure and visualize ground surface volumes directly in 3D. This release introduces two measure types, each designed for a specific purpose:
cut-fill: Computes cut and fill volumes relative to a flat, horizontal surface defined by the input polygon. This is ideal for estimating the amount of material to remove or add to level terrain for construction.
stockpile: Calculates cut and fill volumes against a surface approximated from the polygon’s coordinates. This tool is useful for estimating the volume of temporary ground features such as piles of material, mounds or depressions.
Volume measurement analysis has a consistent API design with the other existing analysis tools, providing results and allowing you to place new or edit existing geometry inputs through its analysis view. Currently it supports analysis on the ground, on integrated mesh layers and on integrated mesh 3D tiles layers.
Parquet layer enhancements (beta)
The parquet layer allows you to visualize and analyze data stored in parquet files in 2D maps. Parquet is a columnar storage file format optimized for use with big data processing frameworks and an efficient format for web. With this release, you can:
- Add non-spatial parquet files to a map, allowing you to visualize tabular data within the parquet layer
- Display parquet layer data in feature table and popup
- Query a parquet layer by attribute and geometry
- Calculate statistics
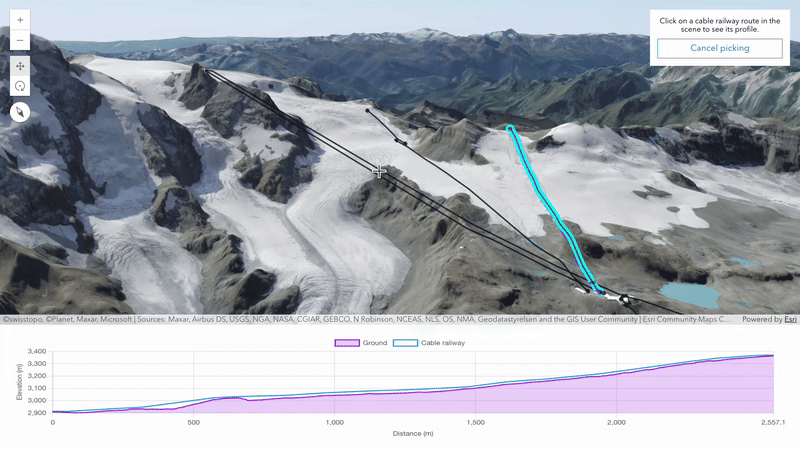
Elevation profile analysis for customized experiences (beta)
Create tailored user experiences to analyze the profiles of your maps and scenes using the elevation profile analysis. This analysis enables programmatic creation and management of elevation profiles and statistics. The analysis results can be visualized in your app using any charting library. Explore the analysis capabilities in this new sample.
Upload georeferenced 3D models
This update extends the scene layer editing capabilities to automatically place uploaded 3D models based on their intrinsic georeferencing information. This simplifies how 3D models can be brought into web scenes by removing the need for manual placement.
The updated sample and guide page on 3D object workflows in the SDK show how you can use the new options.
Accessibility enhancements
Enabling developers to build apps that offer a positive experience for all users, regardless of ability is one of the key focus areas for the SDK. This release introduces the following updates.
Disable animations in 2D Maps: Some users experience motion sensitivity or may prefer less animation in their applications. Providing a way to disable animations helps ensure your maps are comfortable and accessible to everyone. New properties allow you to control all animations in 2D map views. See it in action in the updated Animated symbols sample.
ARIA attributes on Map and Scene: ARIA attributes improve screen reader support and help you build more inclusive applications.
const viewElement = document.querySelector("arcgis-map");
viewElement.aria = {
    label: "New York Transit Map",
    description: "A map showcasing New York City's public transit lines."
};
Last Mile Delivery
Last Mile Delivery is a type of Vehicle Routing Problem operation that can find the most optimized routes for a fleet of vehicles that need to make deliveries. It is specifically tailored to the unique challenges of final deliveries, focusing on efficiency in dense urban environments. It produces geographically clustered routes so drivers can easily visit each location, which minimizes the operating cost for a fleet of vehicles. The SDK now provides a class to easily use this ArcGIS capability.
Learn more
This blog only covers a subset of the new capabilities and enhancements in the release. There is a lot more to learn about, like filtering attachments in the features component and popup, an improved labeling deconfliction strategy, and improvements to oriented imagery support. Read the release notes and explore new samples to get a complete view of the release!


Article Discussion: