The July update to ArcGIS API for JavaScript (version 4.12) is now available and ready for you to try out. This release both enhances 4.11 capabilities such as adding a time slider for temporal-based rendering, and introduces brand new features like realistic water rendering in 3D scenes. 4.12 also introduces a significant performance increase throughout various aspects of the API, having a positive impact on the user experience. This blog highlights some of the enhancements in the release. Check out the release notes for more information.
Performance improvements
Optimizations in the 4.12 release result in overall faster loading of the map. Some of the specific improvements are:
- Vector tile layers: Vector tile layers now load 50% faster due to improved vector tile fetching including more parallelization of requests, and tile processing optimizations.
- Feature layers: Feature layer rendering improved due to optimizations related to triangulation of geometries. Triangulation processing improved without reducing quality.
- Lines: The performance of line processing was greatly increased by minimizing the JavaScript functions calls that need to be executed when processing the line data, and in the case of thin lines, we moved to a simplified processing technique which results in the creation of much fewer vertices without visual artifacts.
- Fast map updates when changing the attribute being rendered: When you change the data you are using for rendering, the map will update quickly without flickering.
- 3D scenes: 3D objects and integrated mesh layers are loaded up to 4x faster using the new i3s specification version 1.7. In addition, a new client-side caching mechanism helps reduce areas without data when exploring a 3D scene.
Performance will continue to increase in upcoming releases, both in the area of initial load time as well as rendering.
Time for a widget, the TimeSlider
You can now build apps that visualize temporal data using the new TimeSlider widget.

At 4.11 we introduced time to client-side and server-side queries. Those same temporal queries could be used in FeatureLayerView filters and effects. Filters provide an efficient way to display a subset of client-side graphics whereas effects allow visual effects to be applied to both included and excluded features. For example, earthquakes within a user defined extent could be colored bright orange, whereas earthquakes outside that extent would appear as semi-transparent gray dots. Because filtering and effects (whether temporal or not) are performed client-side, they are extremely fast even for large datasets.
At 4.12 we added time support directly to the MapView or and SceneViews. Any time-aware layer within the view will automatically honor the view’s time by only showing content that falls within that time extent. To easily manipulate the View time we added the TimeSlider widget. This easy to use and configure widget will update the view’s time whenever there is user interaction.
Developers can optionally use the TimeSlider as a source of TimeExtents to be applied directly to FeatureLayerView effects and filters.
2D Vector Symbols
We added a large collection of more than 100 new vector out of the box symbols (referred to as WebStyleSymbols which are being released in beta) that can be dynamically styled the way you want in 2D MapViews. You can use these symbols in layers to simply indicate location or in data-driven visualizations using size, color, and opacity visual variables. Vector markers provide a nice, crisp display; even as the symbol size grows, quality is not degraded.

Water rendering
Animated water visualizations such as water ripples and sunlight reflections create a realistic feel in a 3D scene. The new WaterSymbol3DLayer has some fun options such as waveStrength which determines the magnitude of the waves and waveDirection which indicates the direction in which the waves travel. You can model a deep blue lake like Lake Tahoe or a turquoise lake like Lake Breinz by setting the dominant color of the water.

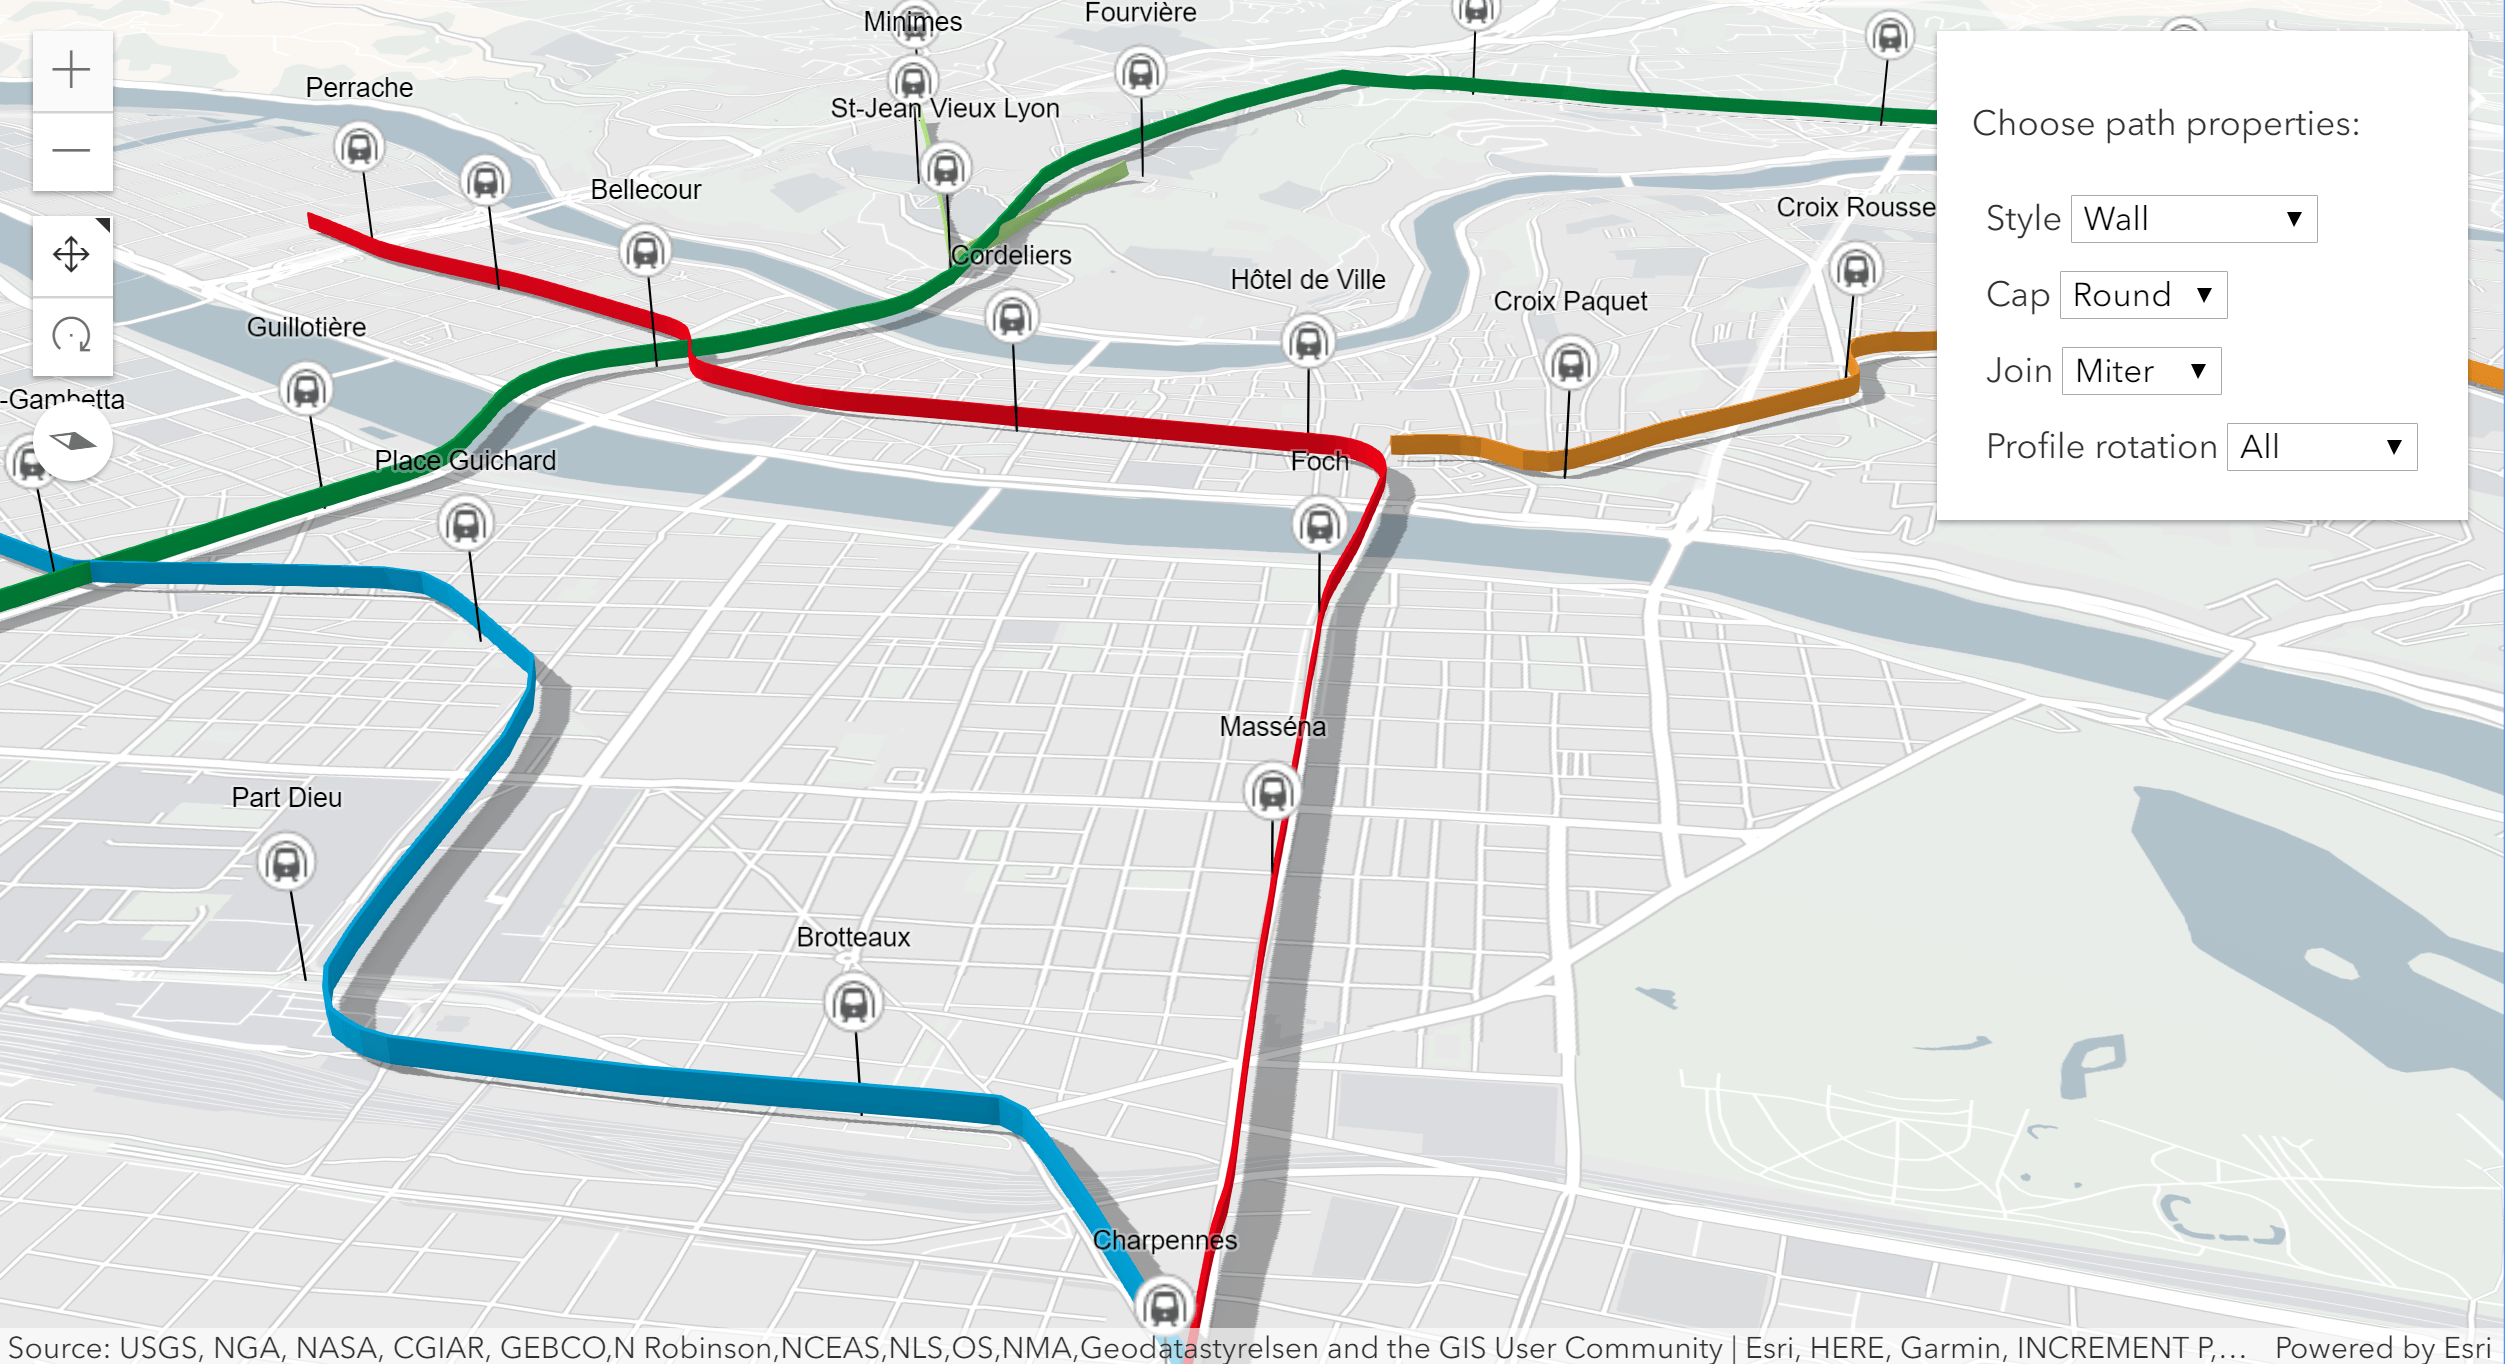
New 3D Line Symbols
The new square profile allows you to visualize 3D lines with square, strips and walls styles. As with other symbols this new profile also supports attribute driven size or color using VisualVariables. Combine the path profiles with the new configuration options for cap, join and profileRotation to enhance the visualization style for line features such as streets or geographical boundaries.
Filters on building scene layers
The BuildingSceneLayer allows you to render detailed 3D building models. With this release we added support for filters, so that you can create applications that isolate floors, highlight building materials or visualize construction phases.
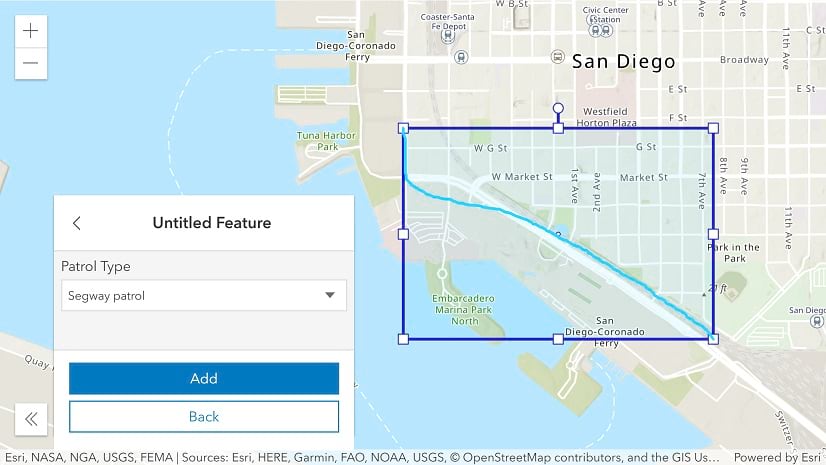
Client-side queries in 3D
Like in 2D MapViews, you can now perform client-side queries with scene layers and feature layers in 3D SceneViews. This enables you to build apps that allow users to interactively select features and display statistics using spatial- and attribute-based expressions.

Smart mapping
With this release, the API reached parity with the 3.x API’s Smart Mapping capabilities and grew them even further with new functionality. For example, you can choose to have the outline width of polygon symbols dynamically update based on view scale. You can also take advantage of a new convenience method for determining the suggested minSize and maxSize of a scale-dependent size visual variable.
New Slider Widgets
As part of this release, we built new slider widgets from the ground up to enable a rich user experience for exploring data with color, size, or opacity. These sliders incorporate the Histogram widget to help you better understand your data. You can use the slider base class on its own within your apps or extend it to create a custom widget.

Modernization of the API
As both the API and web browsers evolve, we are able to grow the API’s use of native capabilities available in web browsers in place of other libraries. This allows us to reduce the size of the API which improves load performance, among other benefits. Some of our modernization efforts include:
- 93% of the codebase is written in TypeScript.
- esri/request now uses the native Fetch API internally to request resources.
- Most asynchronous methods in the API now support an optional signal parameter of type AbortSignal. See Asynchronous Method Cancellation for more information.
- A new has flag is available to enable asynchronous API functions to return a native JavaScript promise rather than a Dojo promise (dojo/Deferred). More details about this functionality will be available in an upcoming blog post.
- A new number and date formatting module, esri/intl, takes advantage of the browsers internationalization APIs. It includes functions for formatting dates, times and numbers based on locales, regions as well as 24-hour or 12-hour time formats.
Learn more
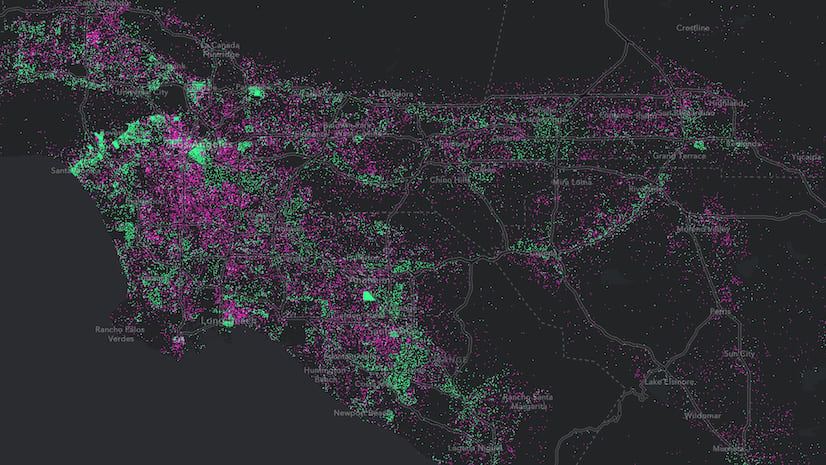
To learn more about this release, check out the 4.12 release notes, and play around with samples that showcase new features. We also added a new app in the Showcase that uses dot density to visualize population by race in the U.S. based on current population estimates.
Version 3.29 was also released with a handful of minor updates and bug fixes; learn more in the 3.29 release notes.
If you are attending the 2019 Esri User Conference next week, come find us at the Developer showcase in the Expo and say hello! You can also use the Top 10 List for Web Developers blog to help navigate the event and plan your week.
For a relaxing 3 minutes of 4.12 demos with music, watch this video 🙂


Commenting is not enabled for this article.