The first JavaScript Maps SDK release of the year (v4.29) is out and is packed full of powerful new capabilities and enhancements! It introduces charts components, access to attributes in vector tile layers, interactive editing constraints, 3D Tiles support, and many other frequently requested bells and whistles. Read on to learn about some of the highlights in the release!
Maps SDK components (beta)
At version 4.28, we introduced a brand-new web component library that maximizes productivity of front-end web development. This release brings a new chart components library, enhanced component APIs, and improvements to the documentation and samples.
The new Charts components package offers a series of charting components that can be added to your applications to provide another dimension to maps – for example, emphasize trends or illustrate comparisons in your data. Each chart type provided in charts components can help to learn more about your data in following ways:
- Bar Chart – Summarize and compare categorical data
- Line Chart – Allows you to visualize change over a continuous range – time or distance
- Pie Chart – Group data into slices to visualize part-to-whole relationships
- Histogram – summarize the distribution of a continuous numeric variable by measuring the frequency at which certain values appear in dataset
- Scatterplot – visualize the relationship between two numerical variables
- Boxplot – visualize and compare the distribution and central tendency of numeric values through their quartiles.
They can be configured in Map Viewer and saved to your webmap or layer, then simply loaded in the chart component in your app or defined directly in code using the Chart model class.

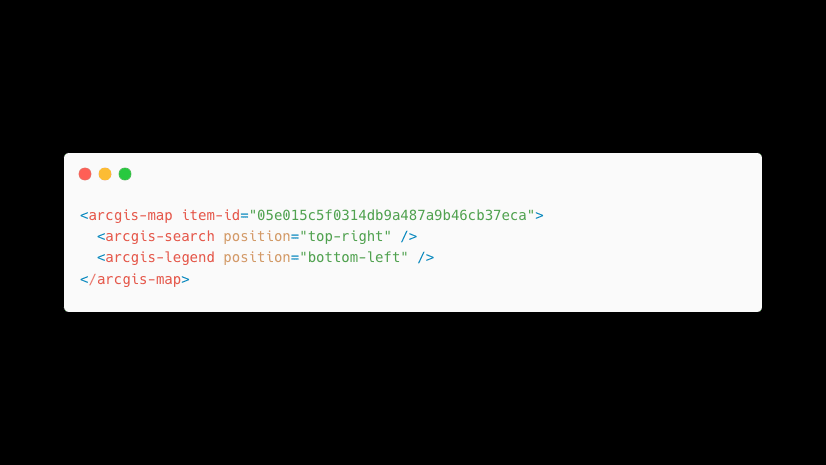
In the above example, a chart was first configured in Map Viewer, and saved to the feature layer in ArcGIS Online. In order to display the chart in the app, the chart component is added via HTML:
<arcgis-charts-scatter-plot id="scatter-plot">
  <arcgis-charts-action-bar slot="action-bar"></arcgis-charts-action-bar>
</arcgis-charts-scatter-plot>
The code snippet below gets the configuration from the feature layer, and wires together the layer and config with the chart.
//first get the feature layer that has charts configured with it, then...
const config = layer.charts[0];
const scatterPlot = document.getElementById("scatter-plot");

scatterPlot.config = config;
scatterPlot.layer = layer;
New documentation: We have added new guide topics describing programming patterns for working with web components and how to get started with your preferred frontend setup. More details about components have also been added to the component API reference of each component package.
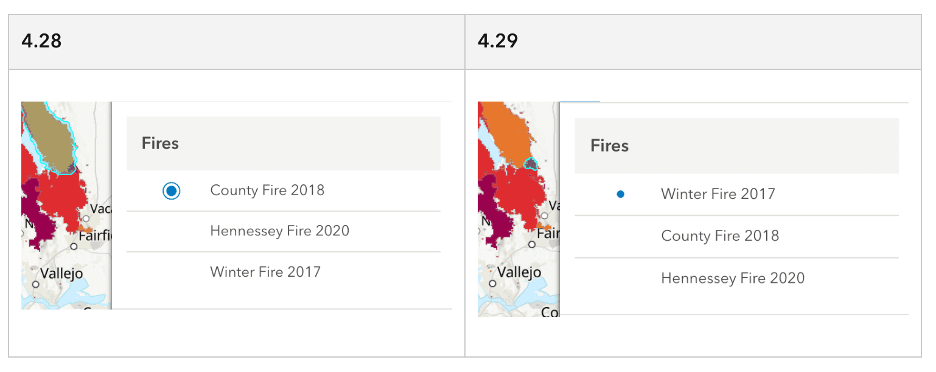
Component API updates: In an effort to evolve the component API design, updates were made to the map components API. Some of the major changes include:
- The
<arcgis-map/>and<arcgis-scene/>components’viewReadyevent has been renamed toarcgisViewReadyChange. - All
viewandreadyevents now start witharcgis. - Properties from the View have been promoted to
<arcgis-map/>and<arcgis-scene/>with the goal of simplifying access to all properties, methods and events.
Visit the component reference for each component to check out the new properties, events, and methods.
The JavaScript Maps SDK’s component library will continue to expand over time with more pre-built ArcGIS experiences (encapsulated into web components) that can be easily brought into your own app.
Access attributes from Vector Tile Layers
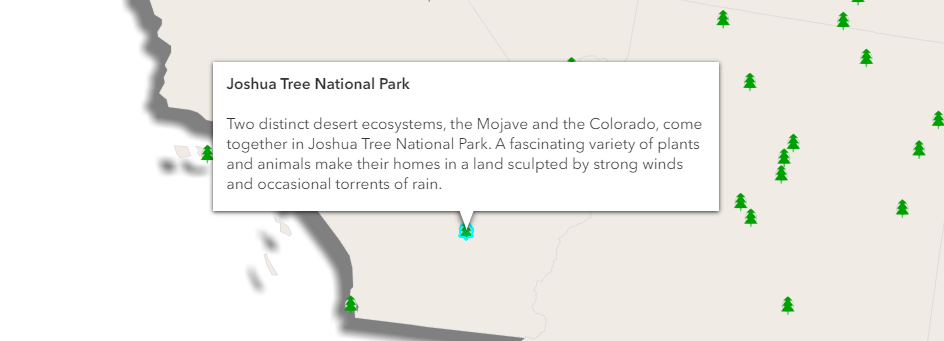
Directly access attributes that are published with vector tile layers in 2D map views. When the map is clicked, the hitTest method finds the intersecting features within the vector tile layer and provides access to the features’ attributes. In the example below, attributes from the vector tile layer are displayed in a tooltip.
Note: While this approach is useful for basic scenarios, carefully consider whether feature layers are a better fit for your requirements. For example, as more attributes are published with vector tile layers, performance degrades and can become a slower alternative than feature layers which are highly optimized for working with attributes. Feature layers also provide continuous feature geometries while vector tile layers are limited to feature attributes.
Get features based on drawing order
When viewing pop-ups, features from multiple layers are now displayed in the order they are displayed in the map. This also applies when using the hittest method on a map view. Previously, features were displayed based on the order they were returned from the server.
Editing & sketching improvements
Interactive drawing with constraints: New editing constraints allow for more control and efficiency while drawing in 2D and 3D. By enabling tooltips and pressing Tab, the segment length, angles, and elevation constraints can be set directly in the tooltip. This capability is available in both the Editor and Sketch widgets, along with SketchViewModel.
Directional pad (D-Pad): With the new directional pad widget, you can move the 2D map in eight directions using directional controls, making it easier to pan the map when map navigation is disabled while editing.
Improved date and time editing: Editing date-only, time-only, and timestamp-offset field types are supported in feature table widget. The feature table experience was also updated to use the Calcite Date Picker, Time Picker, and Input Time Zone.
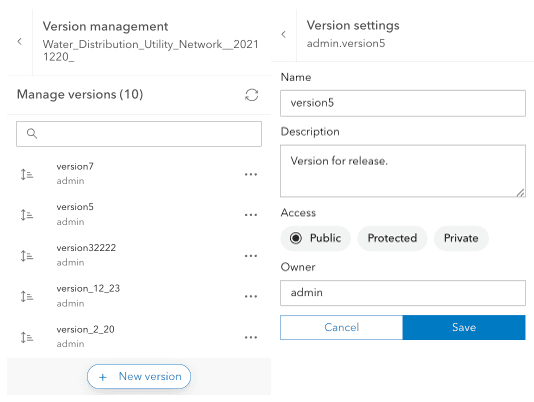
Version management
The new version management component (beta) supports branch versioning workflows in custom web applications, making collaboration on feature datasets easier. Users can access version lists, create versions, switch between versions, and update version settings with the version management component.
3D updates
3D Tiles support: The new IntegratedMesh3DTilesLayer loads integrated mesh data based on a hierarchical data structure defined by the 3D Tiles specification. 3D Tiles are an OGC standard used to visualize large amounts of 3D content, similar to Indexed Scene Layer (I3S) specification for scene layers. Like the existing integrated mesh, 3D Tiles can represent built and natural environments through realistic textures and elevation information can be used in combination with other geospatial content.
Custom visualizations and effects in 3D: Custom render nodes allow WebGL level access to the render pipeline of the Scene View to create custom visualizations and effects. These tasks can range from rendering objects, such as animating the moving parts of a windmill, to applying postprocessing effects, like a camera depth of field.
Render nodes are an evolution of the external renderer which allows even more flexibility. Render nodes can inject custom WebGL code in various stages of the render pipeline to alter their outputs. See the following samples to get a sense for the power of custom render nodes: Color modification, Depth of field, Crossfade slide transition, Animated Windmills
New 3D basemap styles: New 3D Basemap styles were added and existing 3D basemaps are no longer in beta. See the Basemap Gallery sample to explore the new styles.
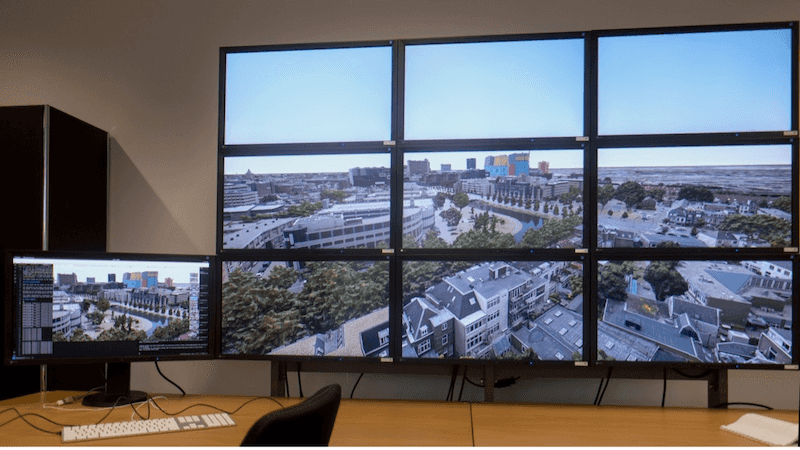
Tiled display support: Developers can now surpass the limitations of a single browser to support large, tiled displays with high resolutions and fluid rendering performance. This is achieved using the enhancement to scene view which enables the rendering of a 2D sub-region of the camera.
The Scalable GIS Renderer project on GitHub illustrates how this can be used for viewing 3D ArcGIS online web scenes on display walls.
Oriented imagery: 360-degree images and editing support
360-degree images: Users can display and interact with 360-degree imagery with the Oriented Imagery Viewer widget, providing a panoramic view of the selected location.
Edit oriented imagery layers: Users can add, modify and delete images in an oriented imagery layer using the Editor widget.
Improved performance
Faster feature layers: We improved the performance and load time of feature layers that are styled with multi-layer CIM symbols in 2D map views.
Smart mapping: Generating heat map is 100x faster than version 4.28 when using smart mapping.
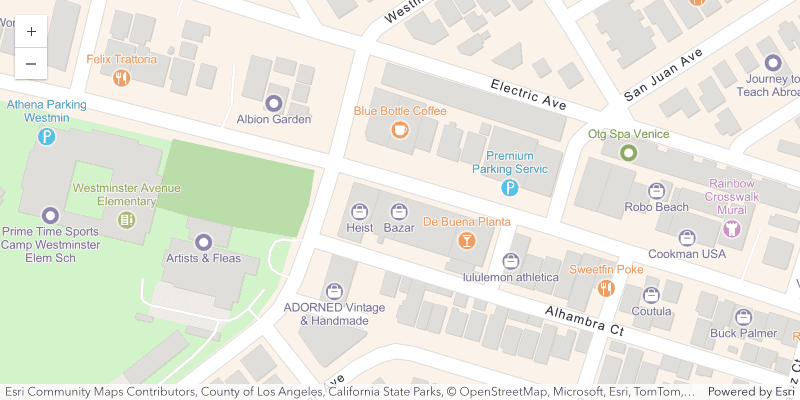
Interactive POIs and world view in basemaps
You can add interactive POIs from the places service in the light and dark navigation basemap styles. Additionally, the new world view property allows you to display country boundaries and labels from the perspective of a specific country.
A few widget highlights
Note: All widget updates also apply to their corresponding components.
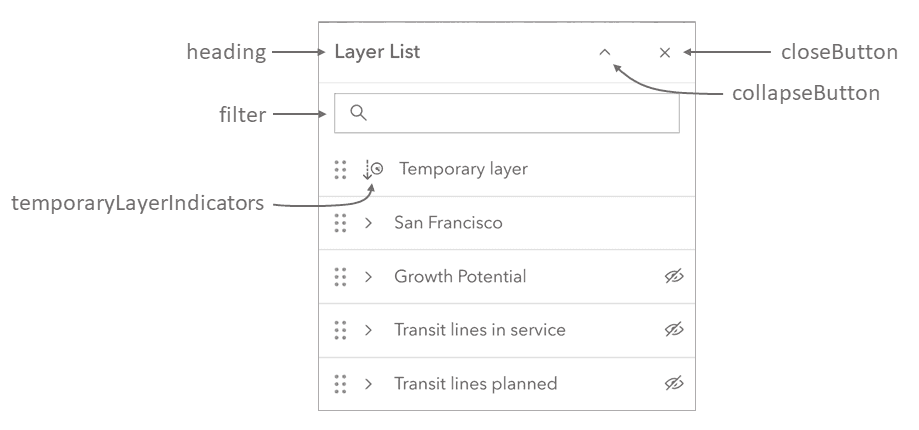
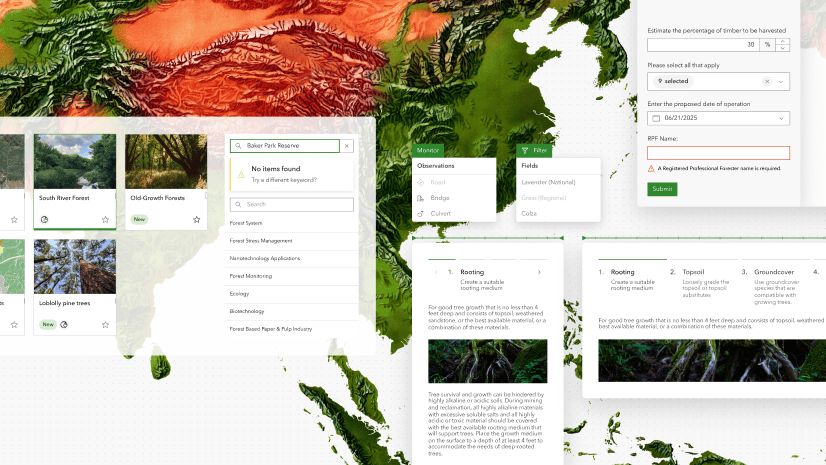
Layer search: Easily find the layer you are looking for using the new filtering capability in the Layer List, Basemap Layer List, and Table List widgets. You can control whether the filter box is displayed using the visibleElements property.
Simplify the popup: With the newly added visible elements properties in the popup, you can control what parts of the popup experience you want to include in your app. For example, you can create an extremely simple popup that only has the basic popup content by hiding all elements, like this:
Deeper use of Calcite in widgets: While all widgets were designed based on Calcite design specifications and use Calcite icons, many are not using Calcite components internally. We are working to update all widgets to use Calcite components for several reasons, including but not limited to:
- Improved user experience (for example, the new filter experience in Layer List, and the Date Picker in Feature Table)
- Better accessibility
- More consistency between widgets
In this release, the following widgets were updated with Calcite components: BasemapLayerList, BasemapToggle, Fullscreen, Home, LayerList, Locate, NavigationToggle, ScaleBar, TableList, Track, and Zoom.
Are you working with frameworks?
Today, many developers are using frameworks for their front-end development. To assist with development with frameworks and the JavaScript Maps SDK, we are gradually adding more resources on the SDK site. Many of these resources are focused on using the new web components (beta) which are particularly useful for building apps with the JS Maps SDK and frameworks. Here are some examples of resources that help you with your web app development within frameworks:
- A new guide topic about the programming patterns when building with frameworks.
- Getting started guide for React & components
- Getting started guide for Angular & components
- A new tutorial that uses Vite
- A subset of samples (11) show how to use ES modules (ESM) – using @arcgis/core and Vite.js. These samples can be run live in the browser using the StackBlitz online development environment without the need to download and install locally. To try it out, search for samples with the ESM tag, and click the ‘Open ESM sample (StackBlitz)’ button.
Learn more
This release contains many features and enhancements not mentioned in this blog post. Check out the release notes and new samples for CoverageJSON support for imagery tile layer, new client-side raster functions, utility network updates, and more.
Join us at Esri Developer Summit
The Esri Developer Summit is a gathering for geospatial developers to learn about the latest web mapping development trends, capabilities, and best practices! We’ve been working hard on delivering inspiring new demos and technical presentations. This is a great opportunity to connect with the JavaScript Maps SDK product team and network with fellow developers. Attend the technical presentations to expand your knowledge, get your questions answered at the Web Development showcase, and enjoy a variety of fun activities at Palm Springs. Check out our web developer’s guide to 2024 Esri Developer Summit for session recommendations and more!
We look forward to seeing you there! If you are unable to attend please check out videos our presentations that will be published shortly thereafter.


Article Discussion: