Before we started shipping FlowRenderer as part of the ArcGIS API for JavaScript (JS API), we published a blog article and an open-source TypeScript demo (repo animated-flow-ts on GitHub) that implemented a simplified version of the same visualization as a custom WebGL layer. This effort was well received by our readers, who started experimenting with the code to adapt it to their use cases. Today, most common flow visualization use cases are handled by the official FlowRenderer, but the original open-source repository animated-flow-ts is still a valuable starting point if you need to satisfy a specific use case. In this article, we explain how to leverage the existing code and custom WebGL layers to create novel visualizations.
What we will build
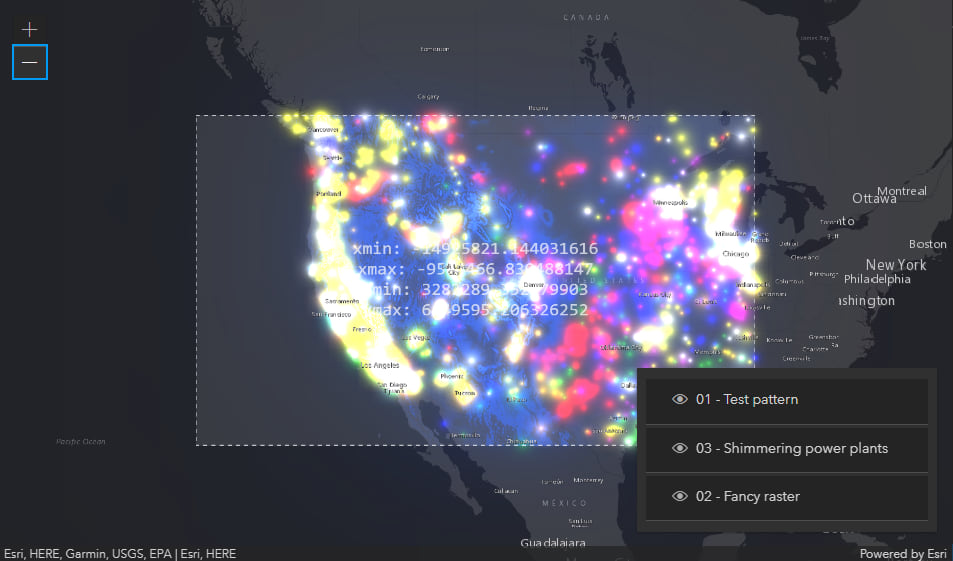
The goal of this article is to explain how the jumpstart.ts app (live demo) in the open-source repository works. This app packs 3 different custom WebGL layers and enables toggling between them using a LayerList widget.
This article assumes familiarity with WebGL. Having experience with BaseLayerViewGL2D can be useful for gaining a deeper understanding of the codebase, but it is not a prerequisite; the code that we are going to write today does not import BaseLayerViewGL2D and is completely unaware of the fact that, behind the scenes, it is the entry point for all custom 2D WebGL rendering operations.
A refresher on custom layers
This section briefly covers how to create custom layers from scratch; we included it for completeness and for providing context, but it is not required for understanding the rest of the article. Feel free to skip to the next section if your focus today is on the rapid creation of new visualizations.
At Esri, we believe that you deserve the best tools for your projects. That is why the JS API ships with many predefined layers, ready to use and backed by our cloud offering.
But we also know that you and your team may have unique requirements, calling for a custom integrated solution. For this reason, the 4x JS API has shipped with support for 3D externalRenderers since its inception in 2016, and custom 2D layers using BaseLayerView2D and BaseLayerViewGL2D since versions 4.8 and 4.11 respectively. This article focuses on custom WebGL layers, the ones that rely on BaseLayerViewGL2D for 2D MapView rendering.
There is an official SDK sample/tutorial that explains how to create custom WebGL layers. In a nutshell, the following steps are involved.
- Inherit a custom 2D WebGL layer view from BaseLayerViewGL2D
- Override method BaseLayerViewGL2D.attach() to create WebGL resources and other objects needed before rendering starts. This method acts as a constructor and is called once by the MapView when the custom layer is added to the map. A common responsibility of this method is to create WebGL programs, quad meshes, and procedural textures.
- Override method BaseLayerViewGL2D.render() to issue draw calls and update WebGL resources that are managed dynamically; examples of dynamic resources are imagery textures and meshes that depend on the level of detail (LOD). This method is called every frame by the MapView.
- Override method BaseLayerViewGL2D.detach() to destroy all resources created by the previous 2 methods. This method acts as a destructor and is called once by the MapView when the custom layer is removed from the map. These 3 methods are the only ones from where WebGL work can be issued; calling WebGL from any other place, including asynchronous callbacks and after await, will likely break rendering for the entire MapView.
- At any time, the custom code can invoke BaseLayerViewGL2D.requestRender() to schedule a new frame, which will result in the MapView redrawing all layers, including the custom one, which in turn will cause BaseLayerViewGL2D.render() to run. BaseLayerViewGL2D.requestRender() can be used to implement animations and schedule updates to dynamic WebGL resources.
- Inherit a custom layer from esri/Layer or some other suitable layer class.
- Override method Layer.createLayerView() to return a new instance of the previously defined custom WebGL layer view.
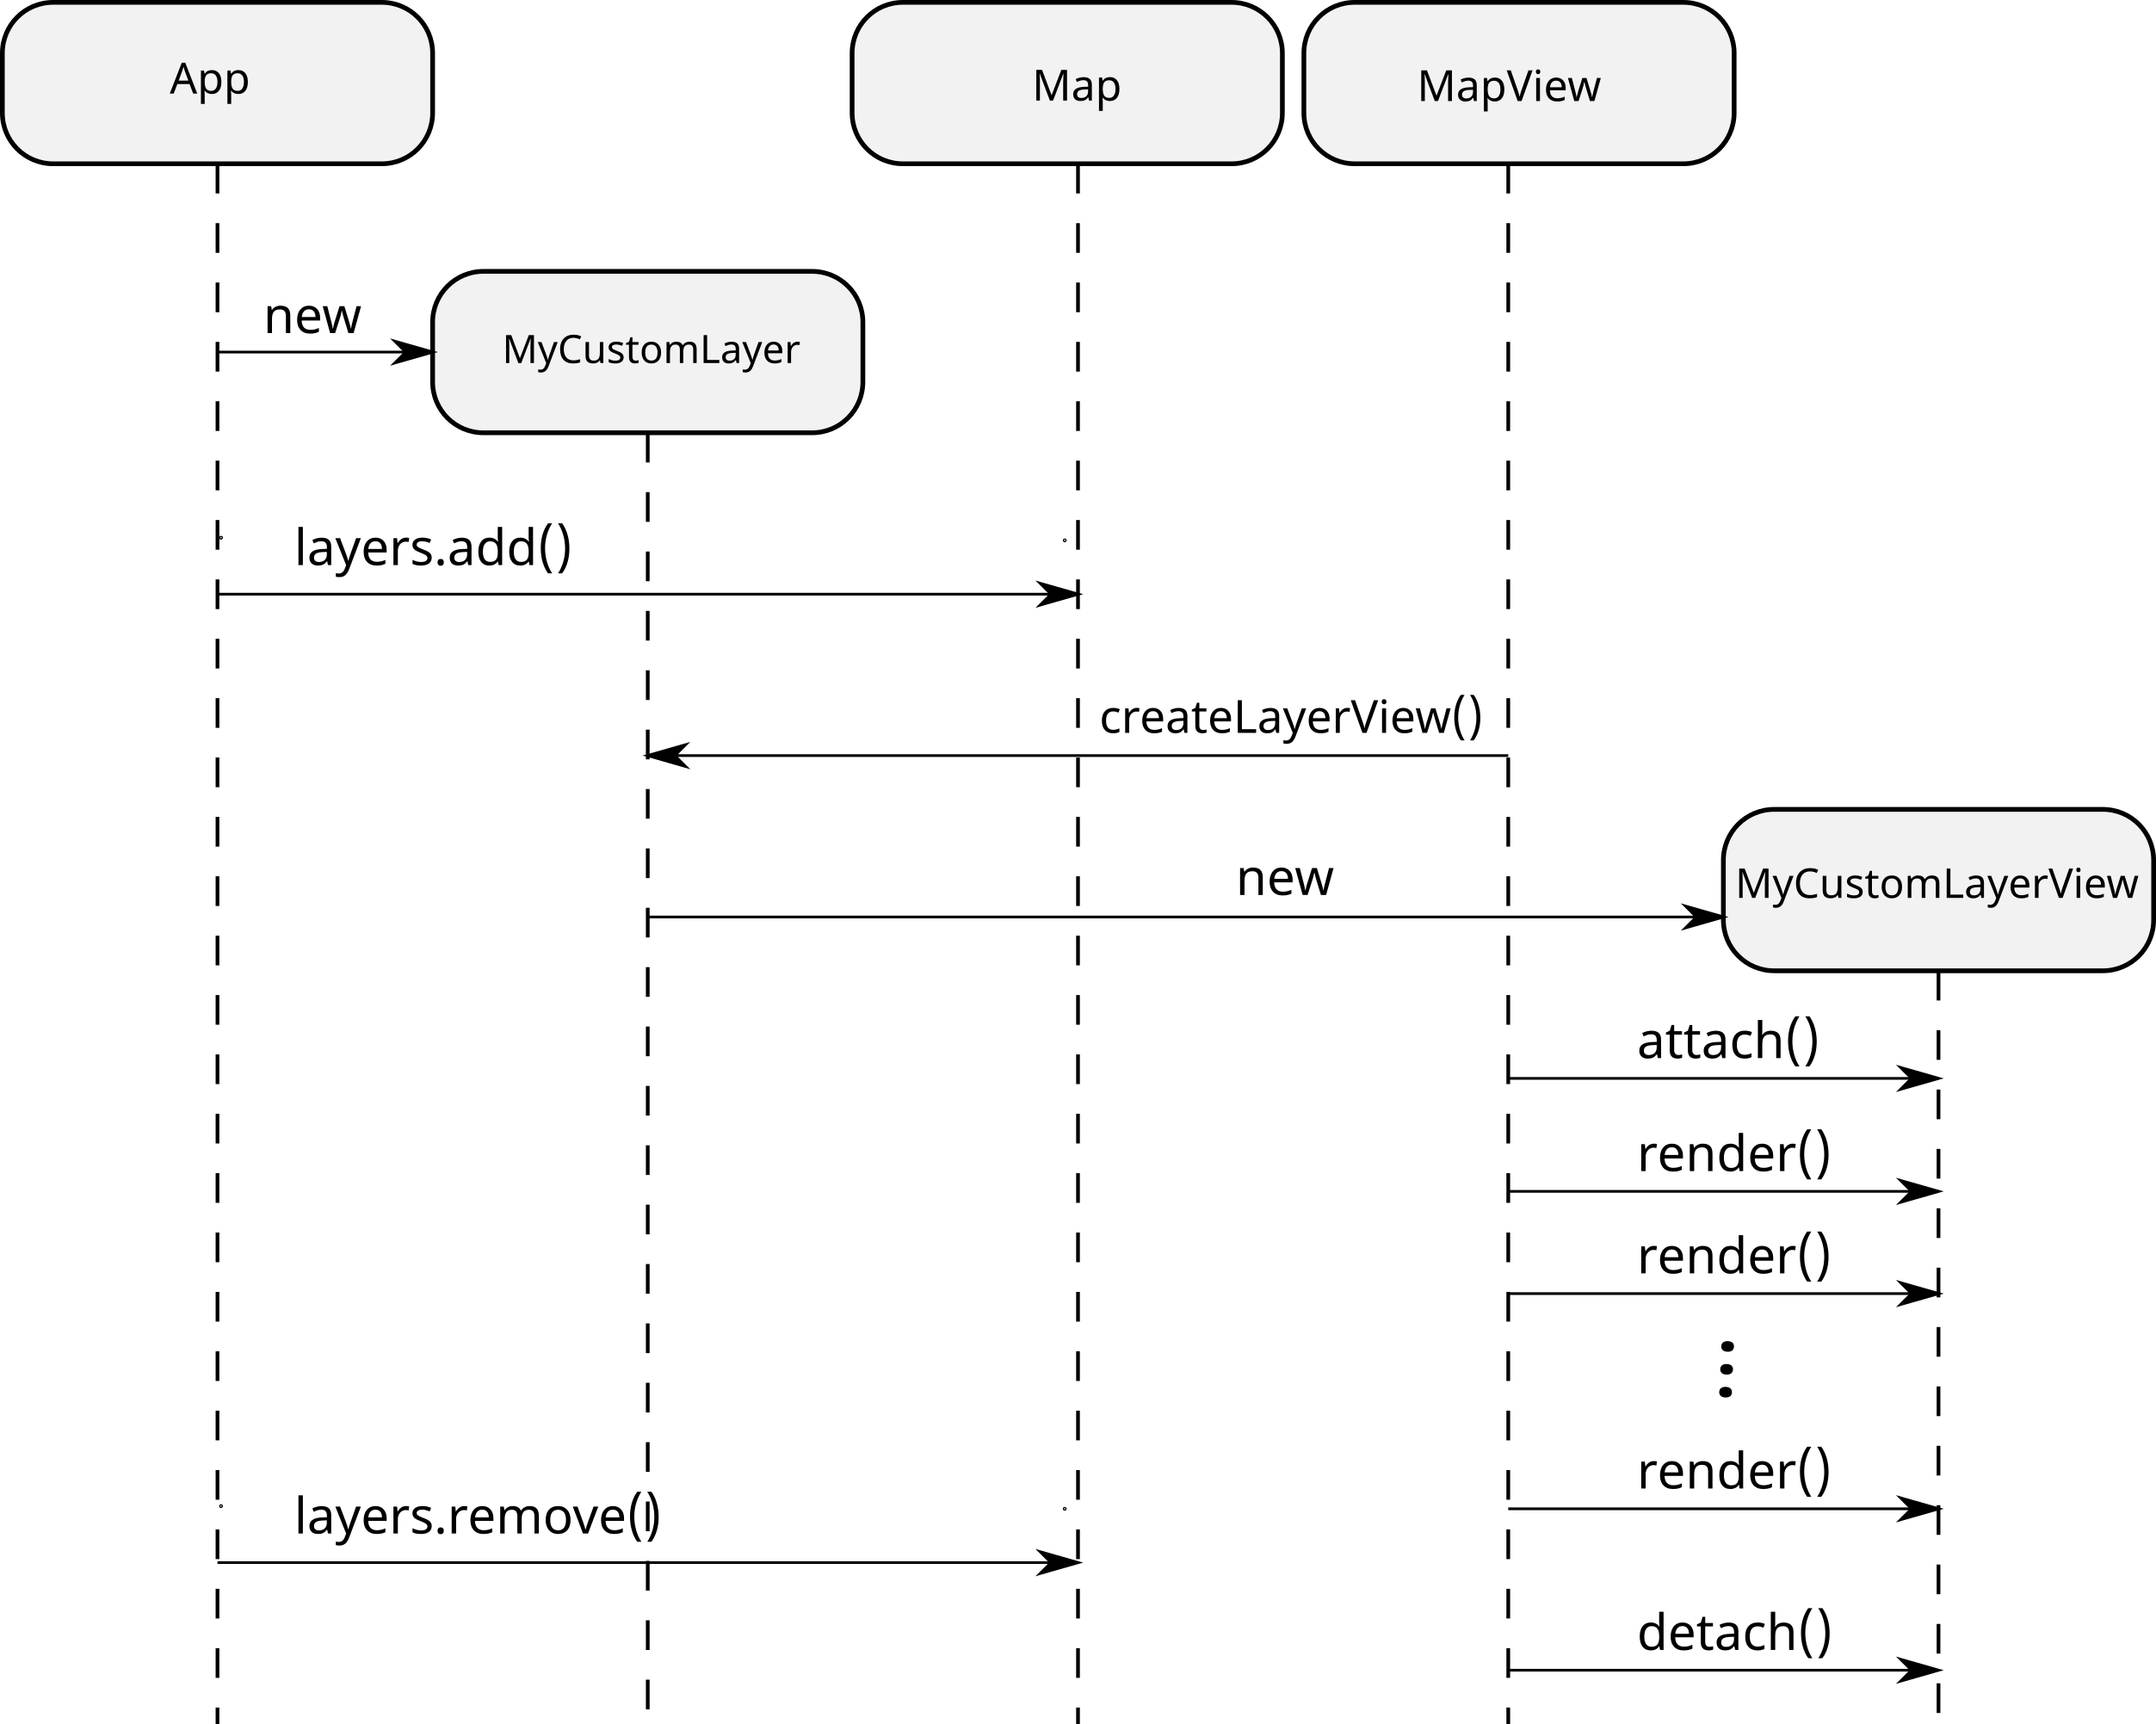
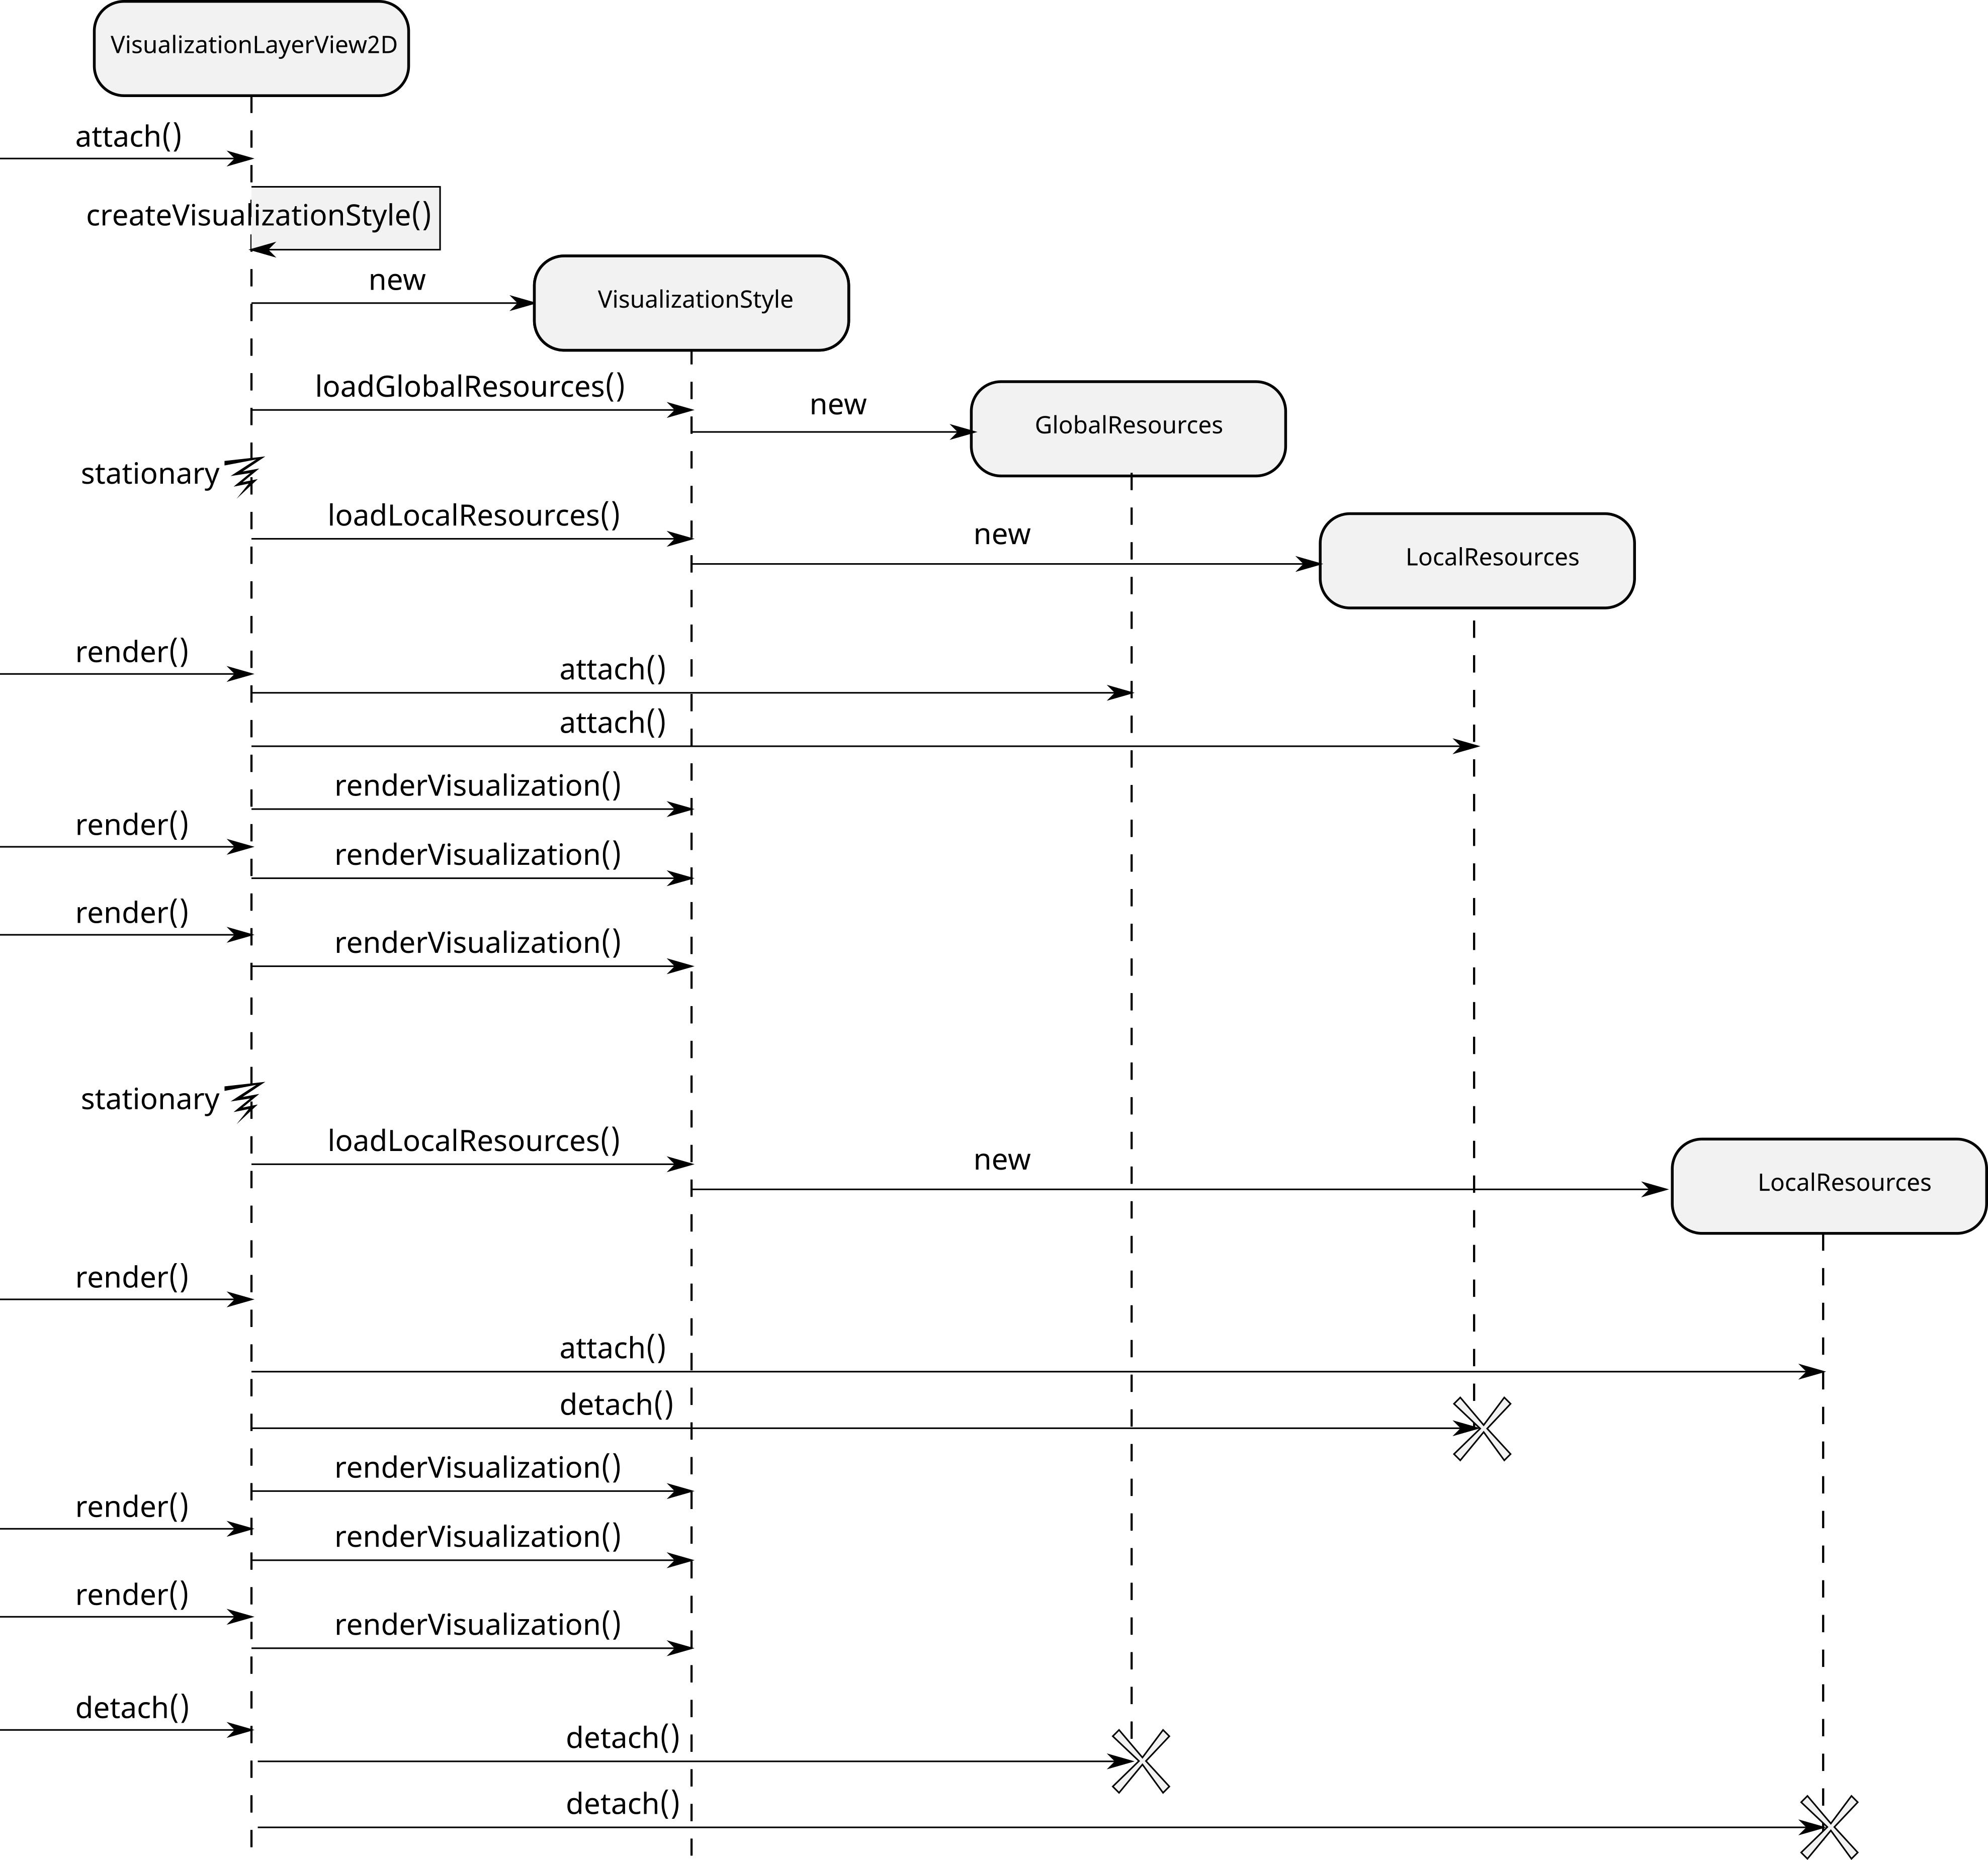
The following sequence diagram shows the runtime interactions between the app and the other objects involved in 2D rendering.
This is the extension experience that we have been supporting for over 10 releases of the API. It could very well be that this is all you need. If that’s the case, great! We have plenty of SDK samples that cover the standard extension workflow in detail, both for BaseLayerViewGL2D and BaseLayerView2D, its Canvas2D counterpart.
But, if you are a WebGL developer and you are looking for ways to boost your productivity, please keep reading!
An overview of the animated-flow-ts repository
Let’s take a look at the code in the animated-flow-ts repo and see how it can help your project.
Start by cloning the repository, cd into it, npm install, and npm start it.
These commands start the TypeScript compiler in --watch mode, so that every time that a .ts file is modified, it is automatically recompiled. In parallel, a test web server starts listening at http://localhost:3000. A browser window should automatically open with a list of demo apps for you to try. The app that we will be using today is called jumpstart. If the browser does not open for some reason, launch your browser of choice, and point it to http://localhost:3000/demos/jumpstart.html.
The repository uses TypeScript and AMD modules.
- The AMD build of the JS API is loaded from the Esri CDN; the JS API also provides the AMD loader itself and the require() function, just like any of our SDK samples.
- the AMD build of the
gl-matrixis also loaded from a CDN; - the local TypeScript files are compiled to AMD modules and loaded.
The two top-level directories are demos and src.
- demos contains HTML files; each file is an app and, at first sight, it looks just like any of our many SDK samples that load the JS API from the CDN. However, these apps also have a
dojoConfigsection that enables the loading of local JavaScript AMD modules from thedemos/jssubdirectory. ThedojoConfigsection also enables the loading for a public release of thegl-matrixlibrary, which we need for WebGL matrix algebra. - src contains TypeScript files. The
tsccommand compiles them to JavaScript AMD modules, in such a way that each.tsfile results in a corresponding.jsfile underdemos/js; these are the files loaded by the apps.
The TypeScript files are organized into 4 packages.
- apps contains files whose names match the HTML apps in demos. Each demo app is configured to load its corresponding JavaScript module, which acts as the entry point and loads all other required modules.
- core implements some generic logic that any 2D custom WebGL layer is expected to need, in one form or another.
- flow contains the implementation of the flow visualization. It depends on the generic
corepackage and adds specific algorithms and techniques that implement the flow visualization. - workers contains code that is designed to run on a web worker. The use of workers is optional but can greatly improve the responsiveness of your application.
The core package
The core package contains a few modules; 3 of them are relevant for implementing new visualizations.
- core/rendering exports a class named
VisualizationStyle. It is an abstract class that is used as a base for concrete visualization styles. A visualization style knows how to load the required data and how to render it. Traditionally, there used to be a single concrete implementation of this class;FlowVisualizationStyleinflow/rendering.tsimplements all the rendering and programming techniques that are unique to the flow visualization that we originally released last August. In this article, we will spend much of our time describing alternate visualizations, each implemented by itsVisualizationStylesubclass. - core/types is a declaration file that contains type definitions and interfaces.
- core/view subclasses BaseLayerViewGL2D and exports
VisualizationLayerView2D. This class functions as an easier starting point for creating custom WebGL layers. In this article, we will create a subclass ofVisualizationLayerView2Dfor each of the alternate visualizations that we will be working on.
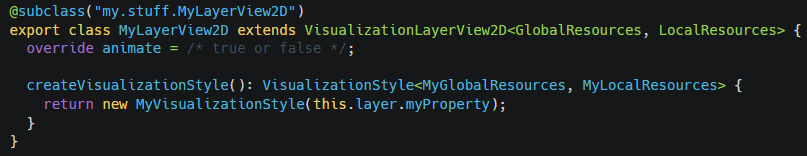
The VisualizationLayerView2D abstract base class
The abstract class VisualizationLayerView2D subclasses BaseLayerViewGL2D and offers an easier, albeit more constrained, extension workflow. To take advantage of it, subclass VisualizationLayerView2D and implement method createVisualizationStyle() to return your style object.
You must also flag the custom layer view as animated or not by implementing the animate flag. An animated layer view will redraw continuously without the need to explicitly invoke requestRender().
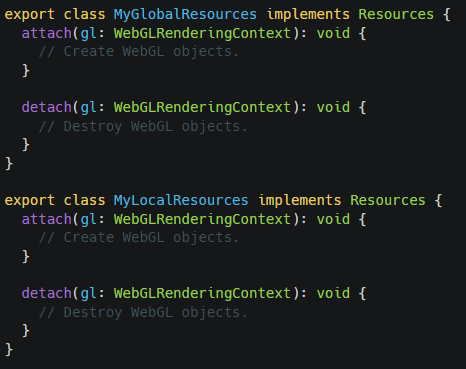
The Resources interface
The Resources interface is defined in core/types and describes an object that supports attach(gl) and detach(gl) methods. Such objects are instantiated by the visualization style in an unattached state. The VisualizationLayerView2D is responsible for attaching them when they are first rendered, and detaching them when they are not needed anymore. Methods attach(gl) and detach(gl) act as a constructor/destructor pair and receive the current WebGL rendering context as a parameter.
These objects are meant as containers of resources needed by the rendering algorithm, including non-garbage-collectible references such as WebGL objects and WebSockets.
At any given time, a visualization relies on a set of global resources and a set of local resources. As such, you need to implement the Resources interface twice.
- Global resources are only loaded and attached once, when the layer is added to the map, and are detached when the layer is removed; they are independent of the view state and do not need to be reloaded when the map is moved around.
- Local resources are dependent on the view state and are created and destroyed frequently, every time that the view becomes stationary after moving the map.
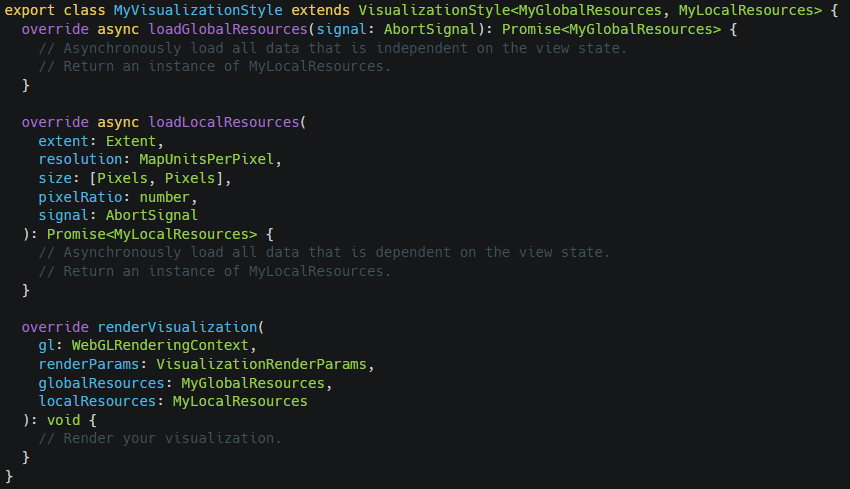
The VisualizationStyle abstract base class
Next, you will need to subclass VisualizationStyle. A visualization style implements the logic that loads and renders resources.
You will need to override 3 methods. These methods are automatically invoked by the layer view when needed.
loadGlobalResources()must return a promise to a concreteResourcesobject. This method is only invoked once, when the layer is added to the map.loadLocalResources()is similar but it is invoked every time that the view state becomes stationary. It receives information about the view state and the target size in pixels so that it can determine what to load and the appropriate LOD.renderVisualization()is invoked every frame and is responsible for issuing the WebGL rendering commands. It receives as inputs the current WebGL rendering context, the global resources, the most recent local resources, and a set ofVisualizationRenderParams.
The VisualizationRenderParams interface
An instance of this type is delivered every frame to the VisualizationStyle.renderVisualization() method. It tells the visualization style where to render the visualization. Here is a list of its most useful properties.
size: [number, number]. The size of the MapView, in pixels.translation: [number, number]. Where the upper-left corner of the rendered visualization should appear, in pixels.rotation: number. The rotation of the view, in radians.scale: number. The scale factor for the visualization. A value of 1 means that the visualization is being rendered at the same scale at which its data was loaded.
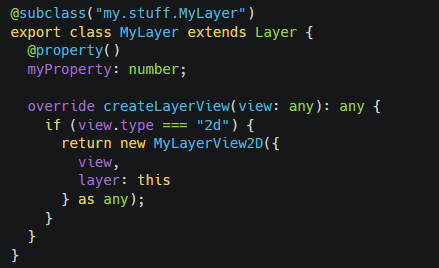
Creating the custom layer class
The core package does not prescribe any particular way to implement the custom layer. As such, the most common way to go about it is to subclass esri/Layer or some other suitable layer type and override createLayerView() to return an instance of the custom layer view.
An alternate extension mechanism
Let’s briefly recap the steps needed to implement a custom WebGL layer by extending VisualizationLayerView2D and the other classes in the core package of the animated-flow-ts repository. Please compare and contrast with the steps taken when extending BaseLayerViewGL2D.
- Decide what kind of resources you need at render time; these could be programs, textures, static or dynamic meshes.
- Implement the
Resourcesinterface twice: first, as a global resources object, holding onto resources needed at all times and which are only loaded once; second, as a local resources object, holding onto resources which are reloaded every time that the map is moved around. - Extend
VisualizationStyle. You need to implement 3 methods;loadGlobalResources(),loadLocalResources(), andrenderVisualization(). - Extend
VisualizationLayerView2D. You need to implementcreateVisualizationStyle()and theanimateflag. - Extend esri/Layer and implement createLayerView() as usual.
As you can see, usage of the core package imposes a lot of structure on the extending code; developers have to implement certain things in a certain way; the standard BaseLayerViewGL2D extension experience, on the other hand, offers much more freedom.
However, there are two benefits to choosing to extend the core package; these cover two aspects of custom layer development that are otherwise pretty difficult to get right.
Benefit #1: Automatic resource life cycle management
Your custom layer view inherits from VisualizationLayerView2D a complete resource management system. You will not have to load, queue, attach, detach, listen, watch, debounce, anything. You just have to split the rendering resources between global and local, implement attach(gl) and detach(gl), and the base classes in core will do the rest.
This automatic behavior is exemplified by the sequence diagram below.
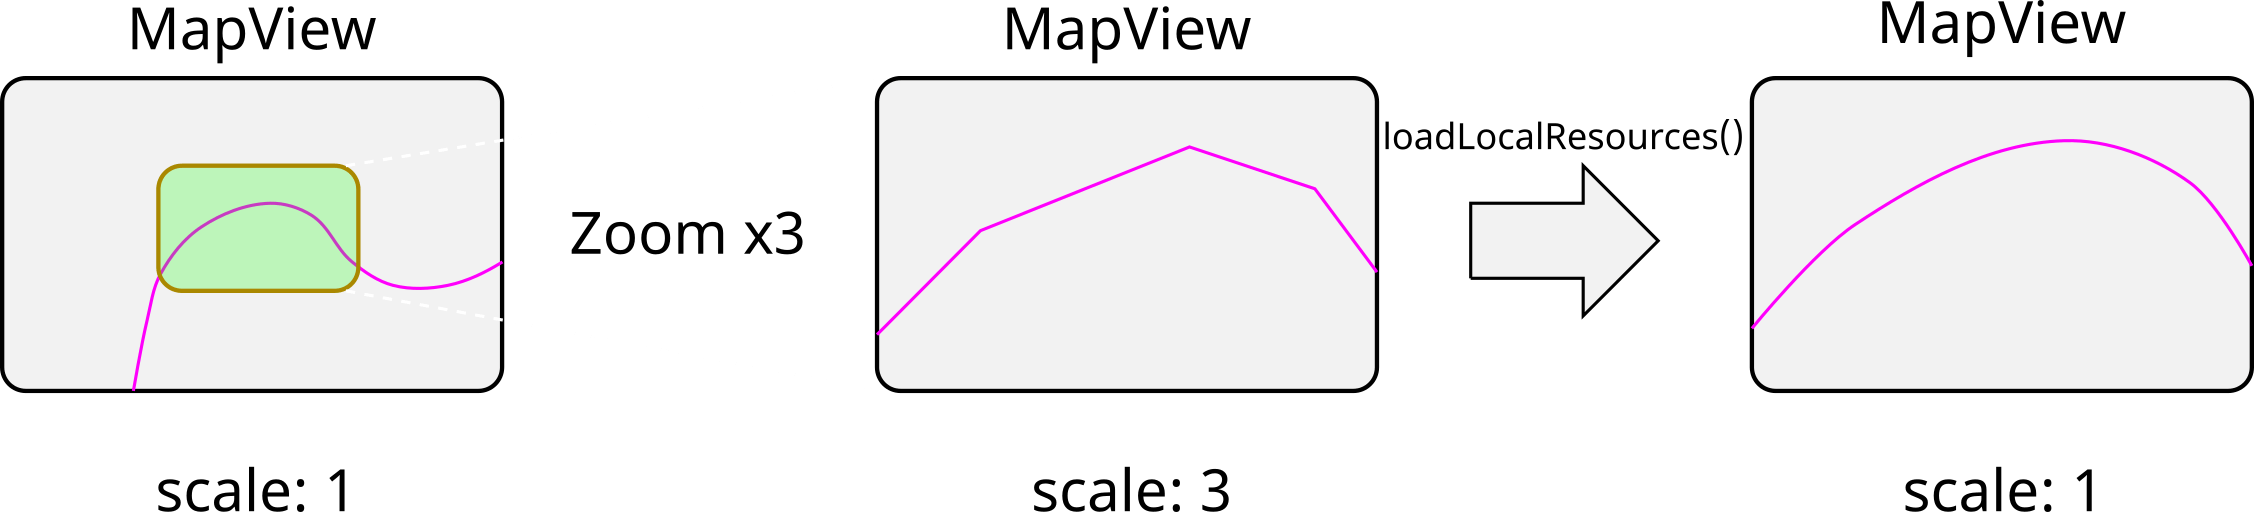
Benefit #2: Simplified view state management
When the view becomes stationary and VisualizationStyle.loadLocalResources() is called, it receives as parameters the extent of the data to load, and the target size in pixels. You can use this information to query the data at the appropriate LOD and return the ideal set of local resources for it. When this happens, the translation and scale passed to VisualizationStyle.renderVisualization() are reset.
The diagram below illustrates the behavior for the case of zooming in and subsequent data reload at a higher LOD.
What we just described is a very important inherited behavior; it implements data refreshing and accurate screen positioning; it is a fundamental component of any real-world large-scale data visualization. Crucially, it enables your WebGL code to support multiple LODs while at the same time keeping your attributes and uniforms as small in magnitude as possible; remember that WebGL shaders use single-precision floating-point (or worse) for all computations, and when attributes or uniforms get too large, positioning tends to get very imprecise.
Please take some time to watch the video below; it illustrates the mechanism in action. See how the idle values for translation and scale are reset every time that loadLocalResources() completes.
The idle values for translation are negative because the origin of the visualization is North-West of the upper left corner of the current extent; this happens because VisualizationLayerView2D tells the visualization style to load an extent that is 15% larger than what is needed to cover the screen. We do this to have some headroom and keep border artifacts away from the area of interest.
Our overview of the repository is complete. Now it’s time to look at 3 brand-new custom visualizations and their implementations! You can find the new custom layers, together with their layer views and visualization styles, in the src/jumpstart folder.
There is an app (.ts, .html) that adds the 3 custom layers to the MapView and we recommend that you keep it open in your browser as you experiment with the code. If you run npm start, a live version of the app should open automatically at http://localhost:3000/demos/jumpstart.html. A live version is also available online.
For each visualization, check out the layer.ts file, which contains the custom layer, and the view.ts file, which contains the custom layer view. See how the layer overrides createLayerView() and how the layer view inherits from VisualizationLayerView2D and overrides createVisualizationStyle().
Then check the rendering.ts file which defines the global resources, the local resources, and the visualization style. All WebGL rendering code resides here. Please note that visualization styles do not require a layer view, and can be instantiated and used independently from the MapView; this can be useful for testing and for generating thumbnails and galleries.
One thing that all the visualization styles in the repo have in common, is the way the transform matrices are handled. For starters, they all use two matrices named u_ScreenFromLocal and u_ClipFromScreen, their uniform locations are always kept in the global resources object, and the actual mat4 instances are always kept in the local resources object. In addition to this, their computation is always done in the same way.
Here is how u_ScreenFromLocal is computed.

And here is how u_ClipFromScreen is computed.

Code sample #1: The view state “test pattern”
This visualization displays the extent passed to loadLocalResources() as a translucent rectangle with a dashed border. It also displays the bounds of the extent in map units.

Some notes about the implementation.
- The shader program, with its uniform locations, and the quad used to render the extent rectangle, are global resources.
- The quad is defined using binary coordinates; at render time, the original size as received by loadLocalResources() is combined with the binary coordinates in the vertex shader so that the quad mesh is “inflated” to the appropriate size, and can be positioned on screen using the
u_ScreenFromLocalandu_ClipFromScreenmatrices. - The texture applied to the quad is a local resource because it depicts the extent rectangle with its bounds in map units, and the bounds change when the data is reloaded.
- Canvas2D is used to generate an image that is then uploaded to a WebGL texture.
Code sample #2: The fancy animated raster
This visualization loads elevation data from an imagery tiled service and animates the opacity of each pixel using a formula that combines the current time, the elevation of the pixel, and a sine function.

Some notes about the implementation.
- The shader program, with its uniform locations, and the quad used to render the extent rectangle, are global resources.
- The quad is defined using binary coordinates; at render time, the original size of the image received by loadLocalResources() is combined with the binary coordinates in the vertex shader so that the quad mesh is “inflated” to the appropriate size, and can be positioned on screen using the
u_ScreenFromLocalandu_ClipFromScreenmatrices. - The texture applied to the quad is a local resource because it must be reloaded using an instance of ImageryTileLayer every time that
loadLocalResources()is called. - After the imagery has been uploaded to the texture in
LocalResources.attach(gl), the image data itself is dropped by nulling the reference. - The URL of the imagery service to use is stored as a property on the layer.
- The layer view passes it down to the created visualization style.
- The layer view flags itself as animated because the fragment shader is time-dependent and the renderVisualization() method uses the current time.
Code sample #3: The shimmering power plants
This visualization loads points from a feature layer and renders them as shimmering luminous dots. The color of the dot is attribute-driven, and the falloff of the opacity is animated using a sine function.

Some notes about the implementation.
- The shader program, with its uniform locations, are global resources.
- The mesh that represents all markers is a local resource because the features must be fetched again, and the WebGL buffers rewritten, every time that
loadLocalResources()is called. - After the mesh data has been uploaded to the buffers in
LocalResources.attach(gl), the typed arrays are dropped by nulling the references. - The layer has several configuration properties.
- The layer view passes them down to the created visualization style.
- The layer view flags itself as animated because the fragment shader is time-dependent and the renderVisualization() method uses the current time.
Conclusions
We hope that you enjoyed this deep dive into the world of custom WebGL layers and that you will find the animated-flow-ts repository useful for your project.
Clone it! Study it! Mod it! Ship it!
Go build something amazing and share your experience on the animated-flow-ts thread on community.esri.com!
Happy coding!

Article Discussion: