The first release of the year is out for ArcGIS Maps SDK for JavaScript! It includes new functionality such as client-side raster functions, snapping while measuring in 3D, more label styles, and other enhancements for creating compelling, interactive web apps with your data. Let’s explore some of the highlights of this release!
Client-side imagery analysis with raster functions
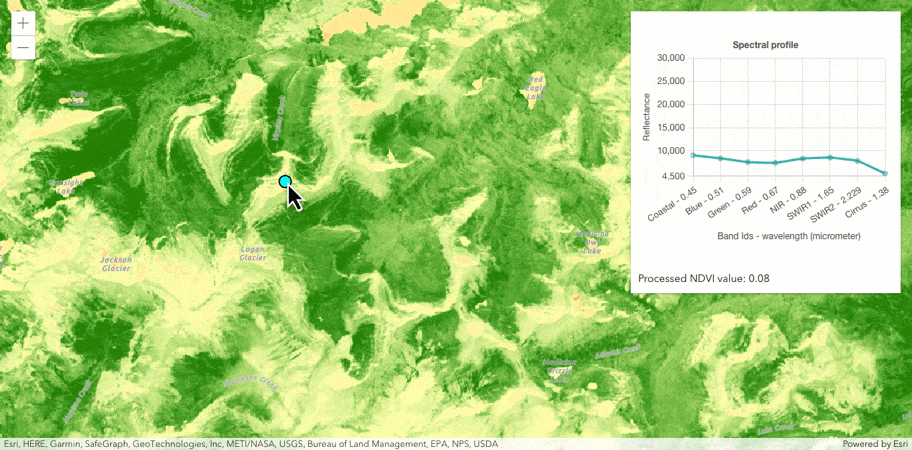
Imagery tile layers now support client-side raster functions (released in beta). The client-side raster functions are operations that apply processing directly to the source image pixels. The calculations are only applied to the source pixels that are visible in the map as you pan and zoom within the map. We will continue to evolve this capability with more raster functions and simplification of how they are used in your code.
The following sample demonstrates how you can use a client-side NDVI raster function to quantify vegetation greenness and use the Colormap raster function to display the result.
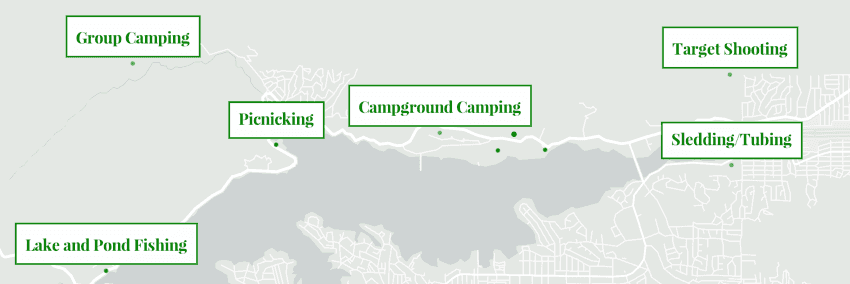
Apply a background and border to labels
We enhanced text symbols to allow you to set the background color, border color, and border width. This can be very useful for labeling, as shown in the updated sample below.
Set a unique highlight symbol for each layer
At this release, features can be highlighted with different symbols per layer in 2D. In a future release, we will add support for this in a 3D SceneView and explore additional highlight options to make the highlighted features stand out from the rest of the map.
Clustering and binning maximum scale
You can now control when clusters and bins break out into individual features when the user zooms beyond a specific scale. This is useful for apps where the user is required to zoom to a large scale where the clustering or binning configuration is no longer needed and individual point locations should display.
The Point clustering – generate suggested configuration sample demonstrates this behavior.
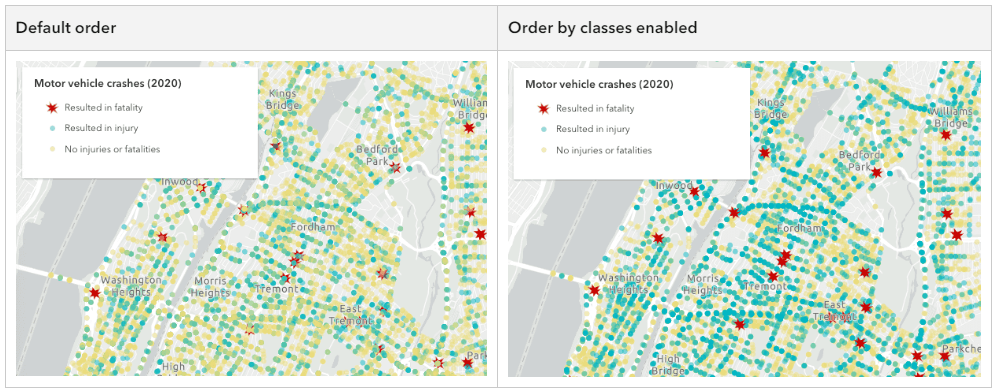
Draw features with higher priority on top
Some use cases call for higher priority features to be drawn on top. While it was possible to control the drawing order based on a field’s number or date value, or based on an arcade expression since 4.21, this update allows you to sort using the ordering of unique values defined in the legend. This way, the features are drawn in the same order that they appear in the legend. To achieve this, set the unique value renderer’s orderByClassesEnabled property to true.
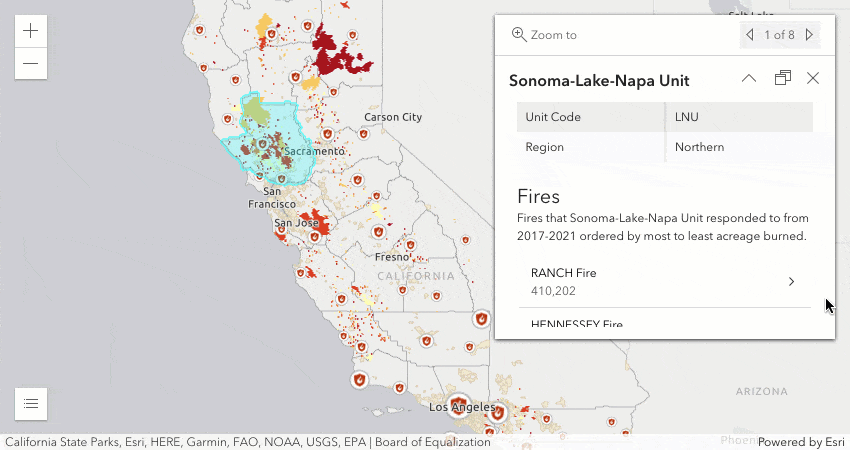
In the below sample, car crash locations are visualized based on severity of injuries. By ordering features by class, we are able to emphasize the crashes that involved a fatality by drawing them on top.
Related to this update is an enhancement in the February update of Map Viewer which allows you to control the display order of overlapping features in layers with Types (unique symbols) or Predominant category styling applied. This means that you can order the features using Map Viewer, save your web map or layer, and then simply load it into your web app.

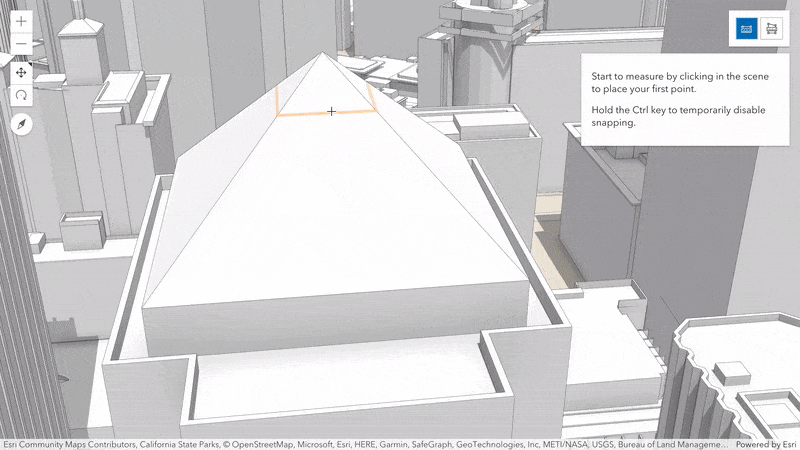
Snapping in 3D measurement tools
Accurately measure lengths and areas of, for example, building roofs and facades using new snapping capabilities. Direct line and area measurements now snap to features and 3D objects in your scene. Snapping is enabled by default and can be toggled by holding the Control key. All tools that rely on snapping in 3D scenes benefit from improved hints, making it easier to snap to draped features or complex BIM data.
Explore the buildings of San Francisco using the updated Measurement in 3D sample.
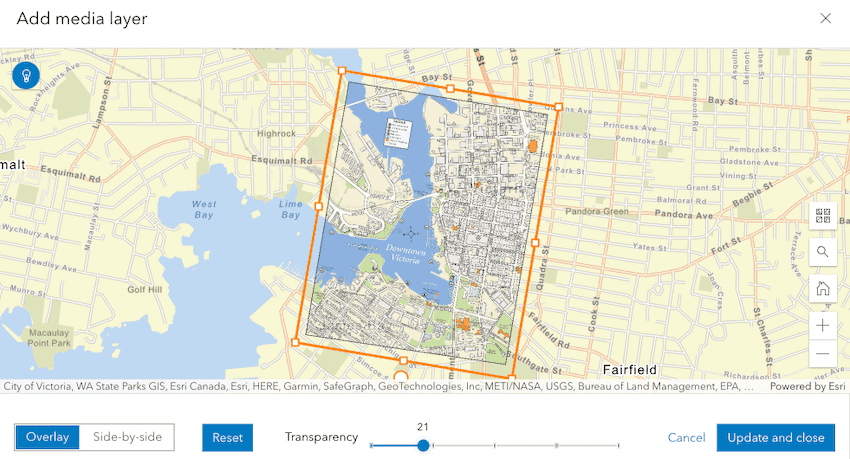
Media layer authoring in Map Viewer
ArcGIS Online’s February update makes it easier for you to position media layers on 2D maps by offering an interactive experience and a side-by-side view for placing anchor points. You can even apply effects and blending to the media layer, as you can with other layer types. Once you are happy with the overlaid image, you can save the web map and later load it into your app.
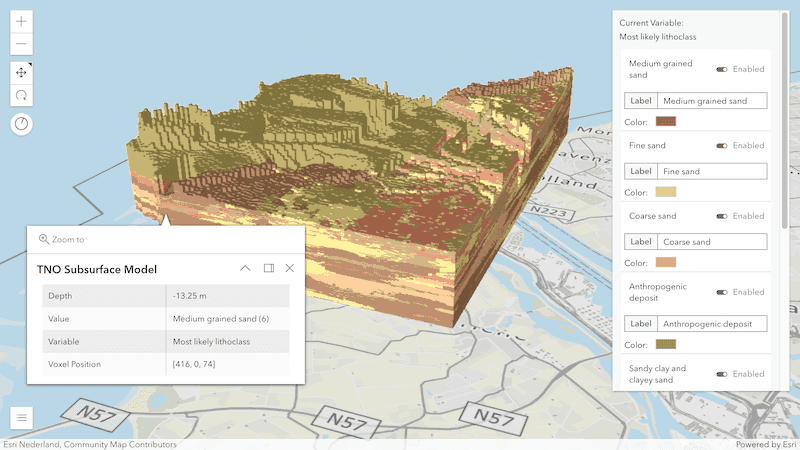
Voxel layer popups and interactive slice
Explore the properties of individual voxels by enabling popups on your voxel layer. The popup shows attributes value, variable and voxel position, and if available also depth and time. Added support for the Slice widget allows you to interactively look inside your dataset and select any voxel.
Try out the new web-based VoxelLayer capabilities with a range of new samples.
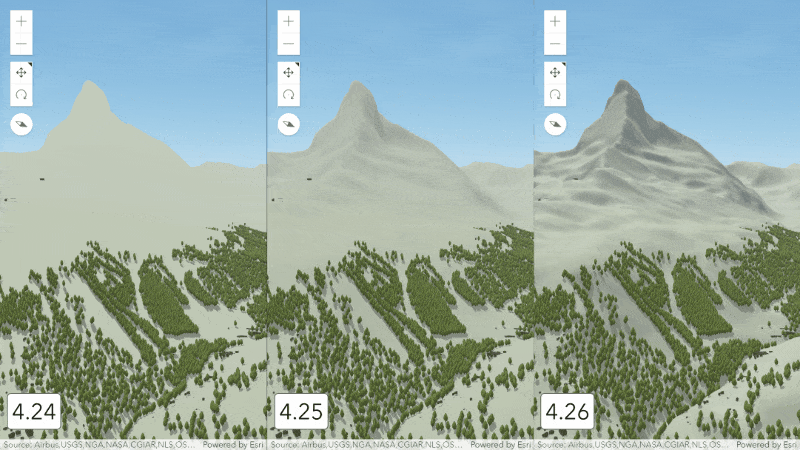
Improved terrain
Experience improved terrain with enhanced shading and increased resolution for all quality modes. In addition to the added contrast, the shading added in 4.25 has been intensified by visualizing the terrain with more detailed geometry. This improved visualization comes without performance impact thanks to various client-side optimizations in terrain rendering.
Select feature in related records popup
The new Select feature action button within RelationshipContent provides a way to highlight and zoom to the selected related feature while also opening the related feature’s popup.
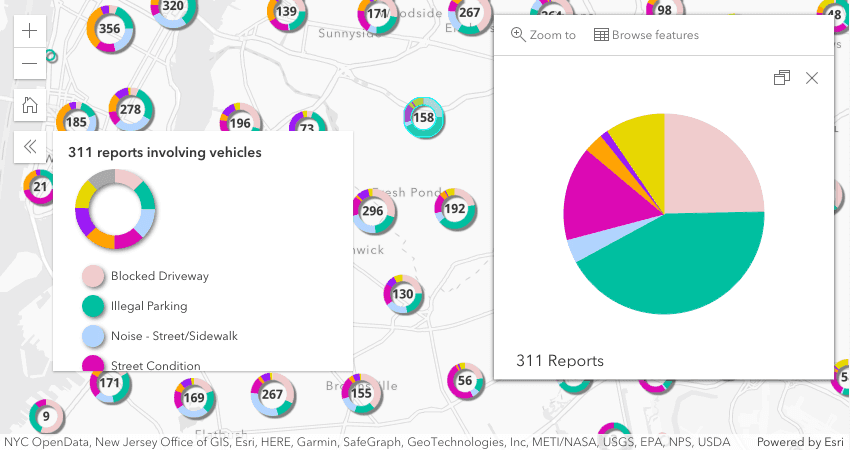
Popup chart colors match layer’s colors
Popup chart colors now automatically match the colors used in cluster and binning renderers. This is supported for binning with the predominance, dot density, and the pie chart renderers, along with clustering with the pie chart renderer.
Duplicate features when sketching
Duplicate one or more selected features using the Sketch widget’s new copy button. The new graphic(s) attributes, geometry, and symbol will be copied from the original graphic(s).
Samples using ESM
We added an ES module (ESM) option to some of the samples for developers that prefer to consume the JavaScript API as ESM. The ESM samples use @arcgis/core and are available as a downloadable Vite.js project that can be installed and built locally using NPM. ESM works with most modern JavaScript frameworks and module bundlers without the need for additional loaders or specialized configurations.
Learn more
For a complete overview of updates in this release, please see the release notes and take the new capabilities for a test drive with the 4.26 samples.
Esri Developer Summit is in 2 weeks!
The Esri Developer Summit is the best opportunity of the year to learn about the latest web mapping development trends, capabilities, and best practices! Many developers on the JavaScript Maps SDK team will be supporting the conference with technical presentations and are very excited to hear about your projects, answer your questions, and get to know you at the Web Development showcase & other events happening throughout the conference. (Speaking of events… DODGEBALL is back!!) We hope to see you there.


Article Discussion: