Welcome to labeling with the 4.x version of the ArcGIS API for JavaScript. Every release adds new functionality and enhancements to labeling in 2D MapViews and 3D SceneViews. What makes labeling so exciting is that it’s much like a Choose Your Own Adventure novel in reverse: you know your desired ending, but how you start and how you get there is totally up to you.
A previous blog introduced 2D labeling at version 4.8, and contains some solid fundamental information. As of version 4.10, you can label pretty much everything. You can label all the major layers. You can label all the geometry types. You can use different font families, colors, and alignments. You can print labels, either in 2D MapViews with the PrintTask, PrintWidget, or MapView.takeScreenshot method, or in 3D SceneViews with the SceneView.takeScreenshot method.
Choose Your Own Labeling Adventure: The Great Outdoors
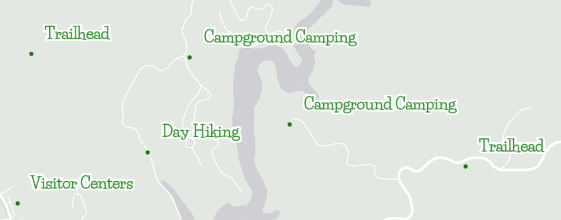
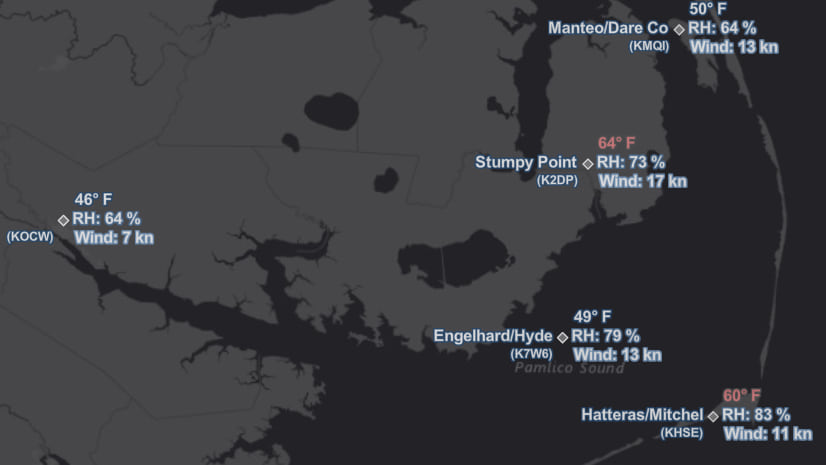
I have been fortunate to spend most of my adult life in or around nature, which is really the best place to go camping. For this adventure, I created a 2D Labeling app that displays outdoor recreation locations (FeatureLayer points) and rivers (FeatureLayer polylines) in the United States.

Use the Bookmarks widget to easily navigate between different scale ranges to see different labels and features displayed on the map. Click the above image to interact with the live app. It’s worth pointing out that the labels are generated on the fly based on the app’s data. So as you zoom or rotate the map, the label placement will change as labels are deconflicted and optimized for display. This allows for massive amount of simultaneous labels to be displayed in the app.
Now let’s explore the code. There are two different labeling styles here to investigate.
FeatureLayer (point) – Life Savers Bold
First, we label a FeatureLayer that displays outdoor recreation opportunities with point geometry. Similar to the above code example, the LabelClass is autocast, meaning that we do not need to import the LabelClass module, and can instead just create an object to hold all the labeling properties. This will be treated as a LabelClass object when we pass it to the labelingInfo property of the FeatureLayer. Here is an example code snippet:
const labelClass = {
  symbol: {
    type: "text",
    color: "green",
    haloColor: "white",
    haloSize: 2,
    font: {
      family: "life-savers",
      size: 12,
      weight: "bold"
    }
  },
  labelPlacement: "above-right",
  labelExpressionInfo: {
    expression: 'DefaultValue($feature.MARKER_ACTIVITY, "no data")'
  }
};

var featureLayer = new FeatureLayer({
  portalItem: { id: "6012738cd1c74582a5f98ea30ae9876f" },
  labelingInfo: [labelClass]
});
Here we did two interesting things. First, we choose the Life Savers Bold font family, because it has a whimsical and outdoorsy look (totally subjective, but it’s my choice after all). I found the syntax to use this font on the currently supported fonts section of the Labeling guide page. Second, because I want the labels to standout against any background, I define the haloColor and haloSize properties of the TextSymbol class to contrast the color property value.
FeatureLayer (polyline) – Arial Unicode MS Regular
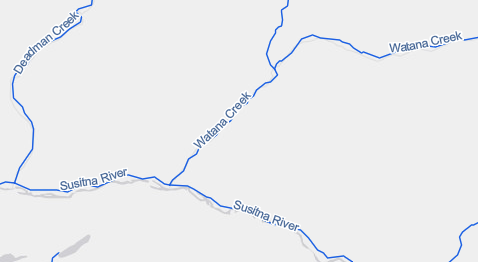
Next, we have a sneaky good way to label features. For this app, we loaded a webmap that serves as both the basemap and a container to hold the polyline layer. 2D FeatureLayer polyline labeling is new at version 4.10. Rather than create a new LabelClass and a new FeatureLayer or MapImageLayer referencing the polyline layer and the LabelClass, we simply added the polyline layer to the webmap and configured the labels in ArcGIS Online. Here is an example code snippet of what that looks like:
const map = new WebMap({
  portalItem: {
    id: "901ab4abfc884c408fc6057f2dc53fbc"
  }
});
That’s it! A few lines of code adds a new FeatureLayer with beautiful labels, and all we have to do is input the portalItem id. We could have used this method for all of our layers and labels, but I think it was valuable to see other choices and paths we could have taken to the end.
Supported Fonts
There are different font properties and resources available depending on the layer type, geometry type, and if you are working in 2D or 3D. Let’s look at the different font choices, and how they work.
MapView Fonts
All font properties are supported in 2D MapViews. The supported font families for FeatureLayer, CSVLayer, and StreamLayer in a 2D MapView are based on Esri hosted fonts files, which are download by the app as needed in .pbf format. If the app requests a font that is not available, it will use the default font family, which is arial-unicode-ms. See the currently supported fonts section of the Labeling guide page to find out more.
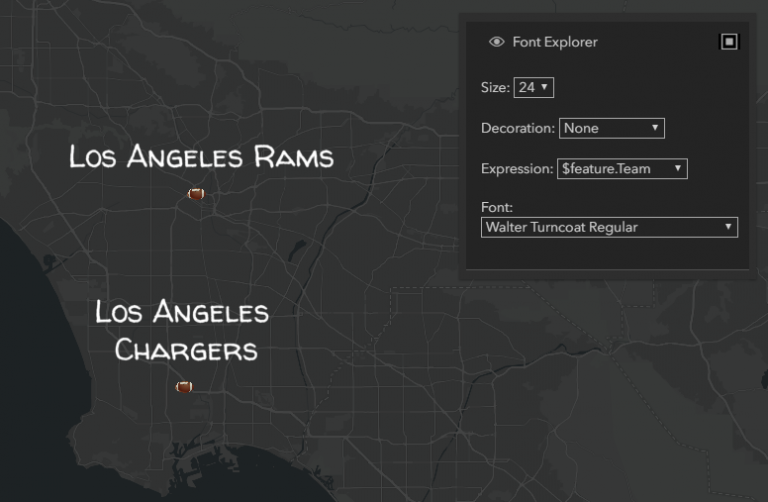
For an interactive experience, check out the below 2D FeatureLayer Font Explorer app that let’s you choose your own adventure with different font sizes, decorations, families, and arcade expressions.
The supported font families for MapImageLayers in a MapView are dependent upon the fonts installed on the ArcGIS Server that published the layer. To check what fonts are available on ArcGIS Server, run the Available Fonts task under Home > services > System > PublishingTools (GPServer) (requires administrator access).
SceneView Fonts
The supported font families for 3D SceneViews are dependent upon the fonts installed on the user’s computer and web browser. If an app uses a font that is not installed, the Font class implements a fallback mechanism that will use the default font family value, which is sans-serif. See the Known Limitations (SceneView) section of the Labeling guide page to understand the current restrictions.
Esri Icon Fonts
The Esri Icon Font is a monochromatic icon set used at Esri for a consistent Esri branded theme. Icon fonts have several advantages, such as the ability to quickly change their color, and the fact that icon fonts can size themselves to be proportional to text placed with them. While the main use of the Esri Icon Fonts is to use them as the symbol property of a Graphic, one could also use them as the font.family property of the Label class. This font works with 2D MapViews and 3D SceneViews.
Labeling Recap
The starting point for labeling features is the LabelClass. Here is where you choose your layer type by setting the labelExpression property when working with MapImageLayer, or the labelExpressionInfo property when working with other layer types. Then you set the symbol property depending on whether you are working with a 2D MapView or a 3D SceneView. If you choose 2D MapView, your next step is the TextSymbol. You can explore the TextSymbol properties, and how they look, in the Symbol Playground. If you choose 3D SceneView, your next steps are LabelSymbol3D then TextSymbol3DLayer. Each of these classes have specific properties and methods that you can access and set as you progress forward to your final destination: Font. Now let’s take a look at the image below that summarizes the current labeling options.
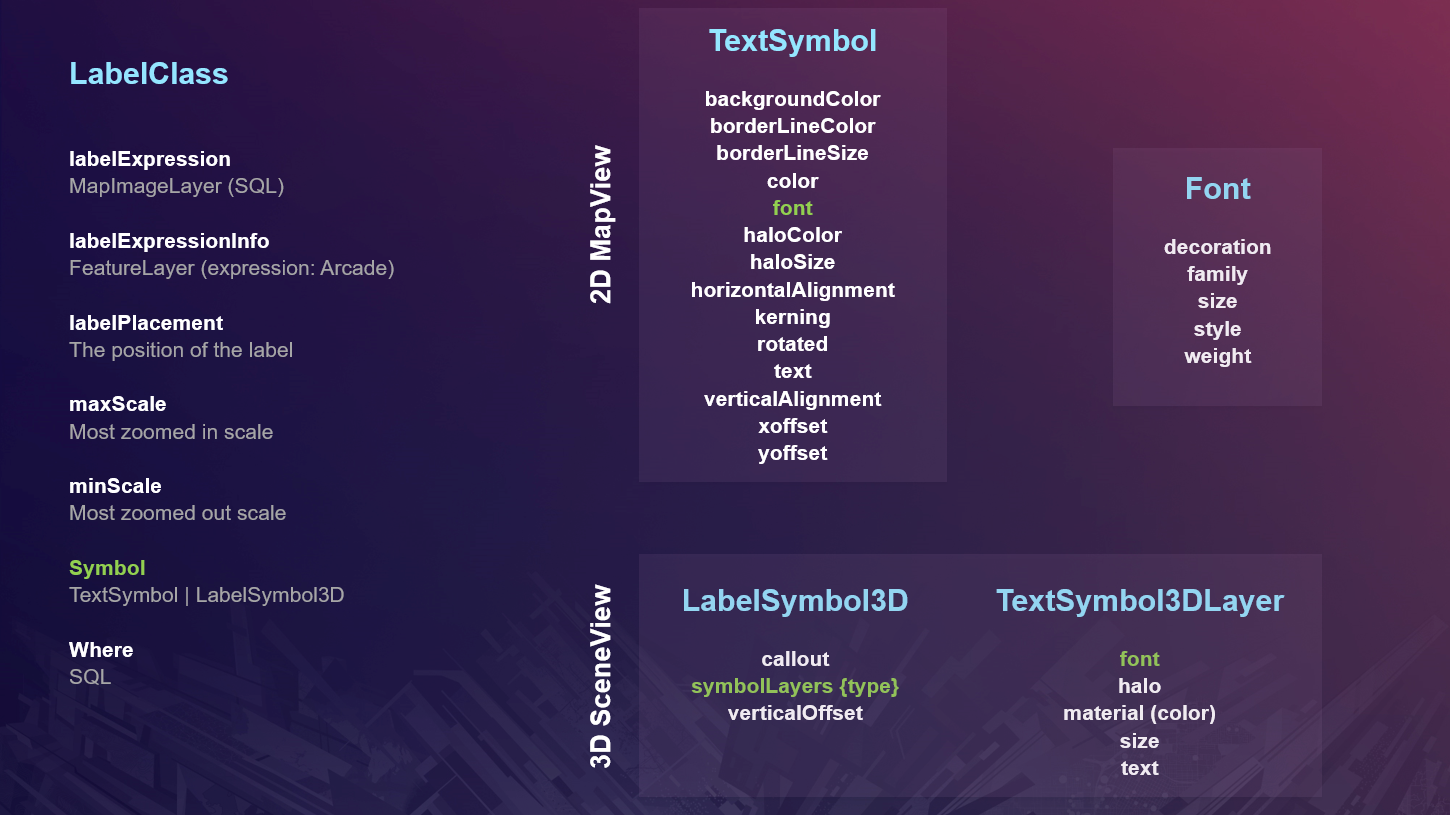
This image depicts the classes needed for labeling, and their associated properties. The green text indicates that the property is a doorway to move through to the next relevant class. While all labeling choices terminate at Font, your options there are affected by your path.
The Road Ahead
We have come a long way, both in terms of labeling functionality and in reading this blog post. We reviewed a lot of different labeling choices and opportunities, and hopefully you found the path that is right for you.
Future releases will include additional labelPlacement values for polylines and polygons in 2D MapViews and 3D SceneViews, improved where clause functionality, and so much more. Best of luck to you on your next labeling adventure!


Commenting is not enabled for this article.