As of the 4.16 release, the ArcGIS API for JavaScript now supports point, line and polygon CIM symbols in 2D MapViews. CIM symbols are high-quality, scalable vector symbols for displaying features and graphics that are precisely displayed at any zoom level without blurriness. The best thing about CIM symbols is that they are completely customizable. They can incorporate multiple symbol layers and can be updated dynamically.
Quick links:
What is CIM | How is CIM used | Examples

What is “CIM”?
CIM is the Esri Cartographic Information Model, which is a map content specification used to persist and transfer cartographic descriptions of GIS datasets. CIM is already being used to create symbology in ArcGIS Pro, so we wanted to bring that advanced symbology to the ArcGIS API for JavaScript. To learn more about CIM and how it works, check out the CIM Specification.
How is CIM used in the ArcGIS API for JavaScript?
CIMSymbol
A CIMSymbol is created by setting the CIMSymbolReference JSON on the CIMSymbol.data property. While there are examples for how to create CIM symbols in the API Reference and Sample Code in the ArcGIS API for JavaScript documentation, the bulk of the documentation lies within the CIM Specification.
// require(["esri/symbols/CIMSymbol"], function(CIMSymbol)
const cimSymbol = new CIMSymbol({
   data: {
      type: "CIMSymbolReference",
      symbol: {
         type: "CIMLineSymbol",
         symbolLayers: [{ ... }]
      },
      primitiveOverrides: [{ ... }]
   }
});
CIMSymbol.data.symbol
The symbol property on CIMSymbolReference can be of type CIMPointSymbol, CIMLineSymbol, CIMPolygonSymbol, or CIMTextSymbol. Each symbol is made up of one or more symbolLayers. CIMTextSymbol is an exception—it has native properties but no symbol layers.
symbolLayers are the building blocks of CIM symbols, they combine to make rich graphical depictions. There are three main types of symbol layers (similar to the simple symbols provided in the API): CIMMarker, CIMStroke, and CIMFill. A SimpleLineSymbol in the API would be equivalent to a CIMSolidStroke symbol layer, a SimpleFillSymbol would be equivalent to CIMSolidFill, and so on. CIMSymbol is unique because you can combine symbol layers to create custom symbols. For example, you could create a CIMLineSymbol with a CIMSolidStroke and CIMMarker symbol to place markers along a line.
Note: CIMLineSymbol and CIMPolygonSymbol are not currently supported in a 3D SceneView.
CIMSymbol.data.primitiveOverrides
The primitiveOverrides property on CIMSymbolReference allows you to use an Arcade expression to override specific properties on the symbol.
WebStyleSymbols
WebStyleSymbols contain a library of pre-defined 2D CIM symbols that you can conveniently reference in your apps. Visit the Esri Web Style Symbols (2D) guide page to see what WebStyleSymbols are currently available in the JavaScript API. The CIM JSON is available for each WebStyleSymbol in the guide page.

Let’s see the CIMSymbol in action!
Now that we’ve learned more about what CIM is and how it’s used in the ArcGIS API for JavaScript, let’s see what it looks like when we use CIM symbols in an application.
Arrows along a line
Let’s say we want to symbolize one-way streets, using arrows to designate the direction of traffic flow. Previously, this would be incredibly difficult to accomplish, but now (as of the 4.16 release), we can create a CIMLineSymbol with two symbol layers – a stroke symbol layer to show the location of the streets, and another symbol layer to place arrow markers on top of the line. Let’s take a look at what that looks like:
CIMSymbol.data = {
   type: "CIMSymbolReference",
   symbol: {
      type: "CIMLineSymbol",
      symbolLayers: [
        {
           // black 1px line symbol
           type: "CIMSolidStroke",
           enable: true,
           width: 1,
           color: [0, 0, 0, 255]
        },
        {
           // arrow symbol
           type: "CIMVectorMarker",
           enable: true,
           size: 5,
           markerPlacement: {
              // places same size markers along the line
              type: "CIMMarkerPlacementAlongLineSameSize",
              endings: "WithMarkers",
              placementTemplate: [19.5] // determines space between each arrow
           },
           frame: {
              xmin: -5,
              ymin: -5,
              xmax: 5,
              ymax: 5
           },
           markerGraphics: [
              {
                 type: "CIMMarkerGraphic",
                 geometry: {
                    rings: [
                      [
                        [-8, -5.47],
                        [-8, 5.6],
                        [1.96, -0.03],
                        [-8, -5.47]
                      ]
                    ]
                 },
                 symbol: {
                    // black fill for the arrow symbol
                    type: "CIMPolygonSymbol",
                    symbolLayers: [
                       {
                          type: "CIMSolidFill",
                          enable: true,
                          color: [0, 0, 0, 255]
                       }
                    ]
                 }
              }
           ]
        }
      ]
   }
}
The resulting symbology on the layer will look like this:

More examples
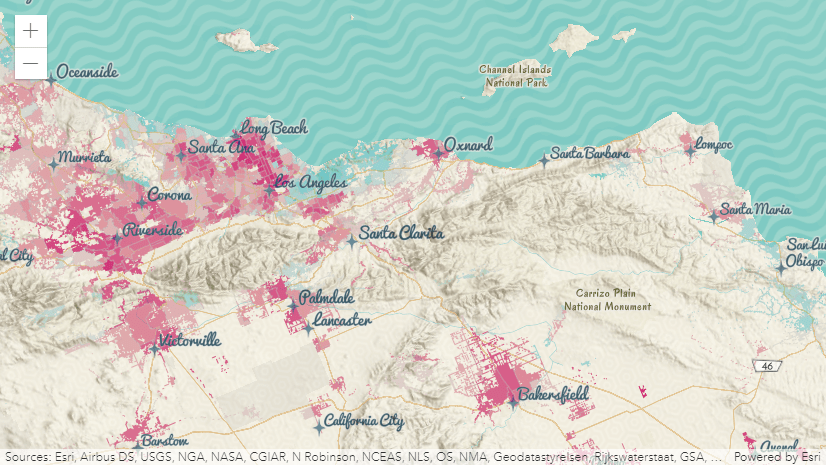
COVID-19 Cases over 14 Days: This app creates a CIMPointSymbol for each county based on the number of COVID-19 cases reported in the past 14 days. The size and geometry of the CIMSymbol is determined based on the number of COVID-19 cases, creating an interesting “spike” visualization highlighting regions with the largest outbreaks.

Lake Tahoe – Tahoe Rim Trail: This app uses CIM symbols in several different ways.
- A CIMLineSymbol visualizes the Tahoe Rim Trail. This line symbol is comprised of three different symbol layers, creating the effect of a cased line with dashes.
- A CIMPolygonSymbol visualizes the boundary of Lake Tahoe.
- Each trailhead is rendered as a WebStyleSymbol. We can use WebStyleSymbol.fetchCIMSymbol() to convert a WebStyleSymbol to a CIMSymbol and then use the cimSymbolUtils class to get and set the size and rotation on these symbols.

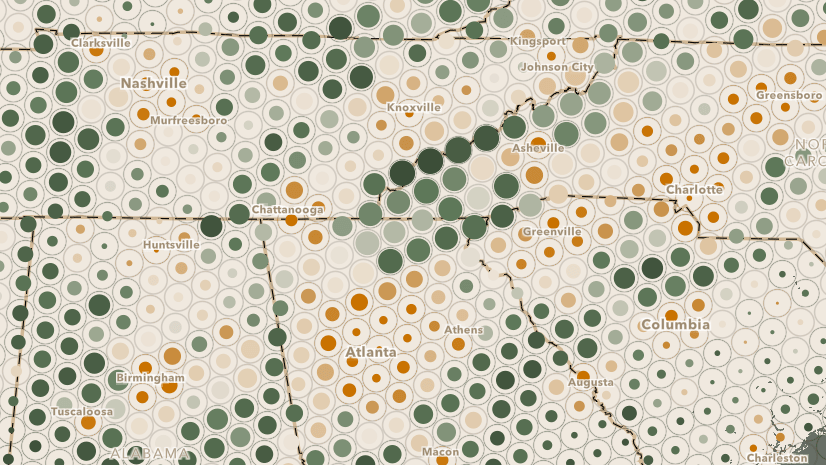
Wurman dots: This app shows how to use CIM symbols with a primitive override. The override uses Arcade to determine the size of the CIMPointSymbol’s inner circle.

CIMSymbol is still in beta. Some properties listed in the CIM Specification are not yet supported in the ArcGIS API for JavaScript. If you are confused why your symbol isn’t appearing as you would expect, make sure to check out the known limitations to see what is or is not supported.
This post includes contributions from Fang Li.

Article Discussion: