Version 4.16 is released, and it includes many new features and enhancements for building state-of-the-art, unique, and powerful web mapping applications. This blog explores some of the release highlights such as cluster labeling, line and polygon vector symbology, water reflections in 3D scenes, and a new way of bringing your data to life with layer blending. Keep reading to explore the release or jump ahead to the topic you are interested in.
Layer Blending — Cluster labeling — OGC API Features — Water reflections — IM modifications — Building Explorer — Vector Symbology — Imagery — Feature table — Popups — API Modernization — More stuff…

Layer blending
Introducing blend modes! This powerful capability allows you to dynamically apply Photoshop-like effects to maps, all within the browser. Rather than producing a static image, you end up with a live, interactive map. This powerful capability allows you to apply one of more than 30 blend modes to your layers to create interesting effects, or even to produce what seems like a new layer.
So what are blend modes anyway?
In the photography and graphic design world, blend modes are commonly used when restoring or retouching photos. In the mapping world, they are used to blend layers together to create an interesting effect in a layer, or even to produce what seems like a new layer from blending the layers in the map. Unlike the method of using transparency which can result in a washed-out layer, blend modes can create a variety of very vibrant and intriguing results by blending a layer with the layer(s) below it. Blending is supported with all layer types, and you can blend any number of layers together.
To blend layers in your app, you simply set the blendMode property on the layer:
const layer = new FeatureLayer({
    url: “url”,
    blendMode: “multiply”
});
An alternative to implementing blending in your code is using the ArcGIS Online map viewer beta (after the upcoming update) to create a web map with blended layers, and then loading the web map in your app. This is a great way to play around with the layers you want to blend, the variety of modes available, and the ordering of layers.
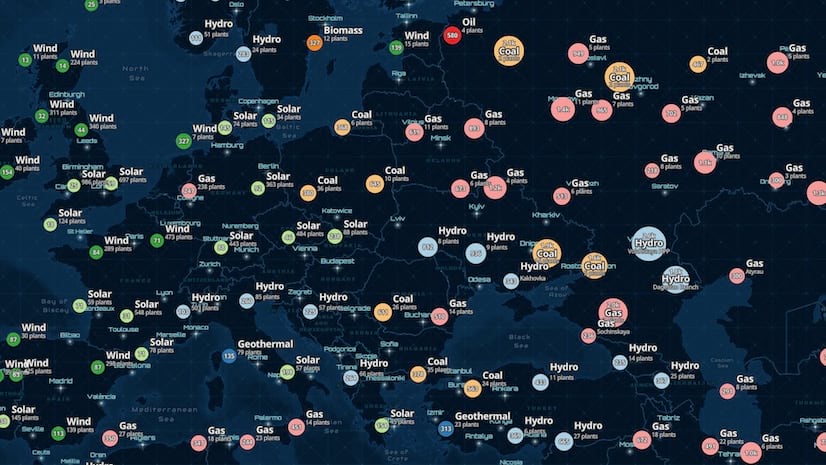
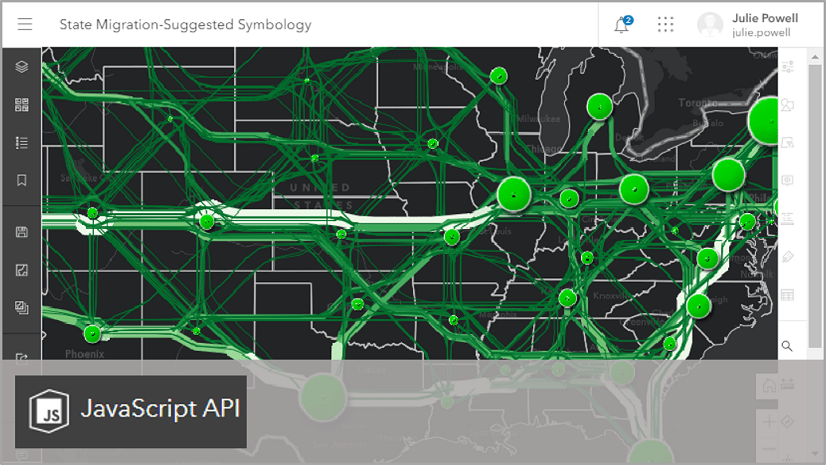
Cluster labeling
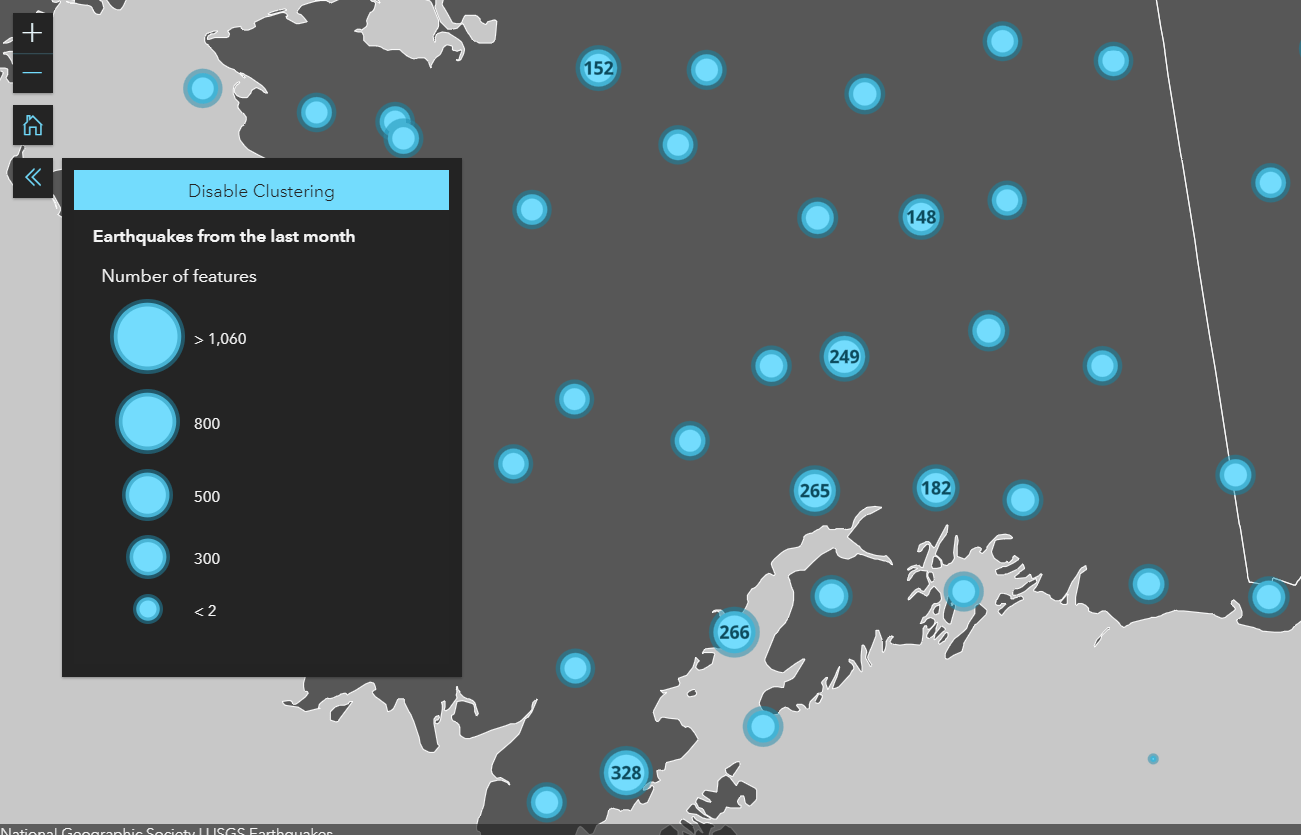
We introduced clustering in the 4.x API last December (4.14). Now you can label clusters – not only with a simple count of features that each cluster represents, but with the full flexibility of the API’s LabelClass capabilities. That means you can:
- Create one or more labels that are dynamically driven based on an Arcade expression using attribute values, like in this sample.
- Utilize any summary statistics used by the cluster popup, such as average of a number field, and predominant value of a string field.
- Control the positioning of the label(s).
- Define a condition on when label(s) are to be displayed.
- Display multi-line labels.
This example is showing clustered earthquakes. Labels are only displayed when there are more than 100 features in a cluster. To implement this, I set a where clause:
where: “cluster_count > 100”
OGC API Features – the evolution of WFS
A new layer type called OGCFeatureLayer allows you to visualize data from a OGC API Features service in both 2D and 3D. The OGC API Features standard is the successor to the earlier OGC Web Feature Service (WFS) specification. The new standard is adopted by several server implementations as it has many improvements over WFS; including faster performance and a modernized design that is consistent and modularized. Support for WFS is still under consideration.
Water reflections
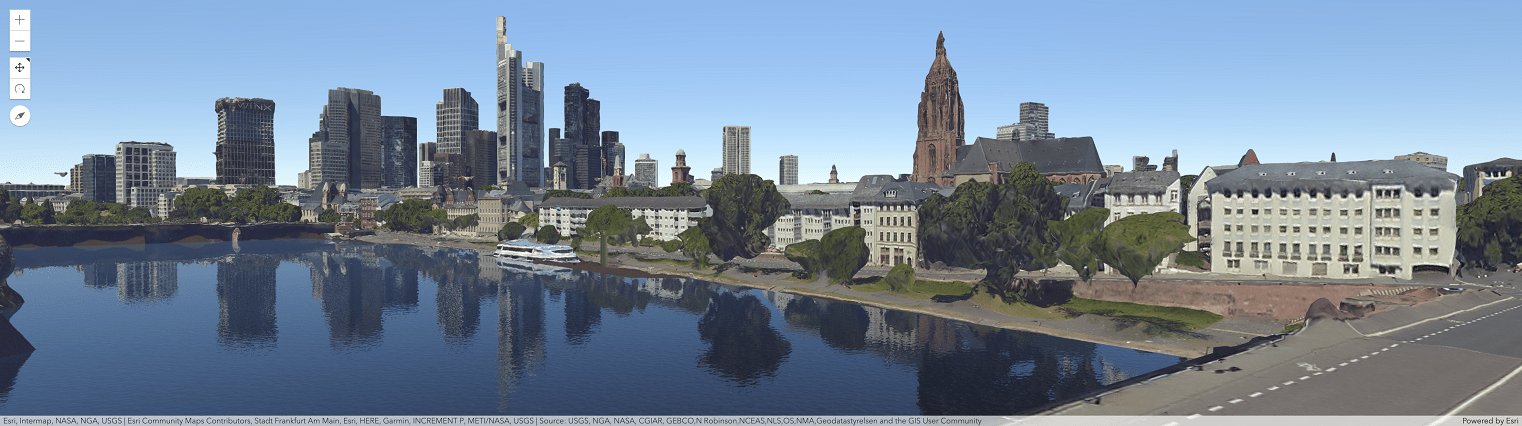
We continue to improve the 3D visual quality of scenes. Earlier this year, we added physically based rendering (PBR) material support and improved overall lighting, and with this release we are introducing water reflections. With this addition, you can achieve a realistic look by displaying reflections of buildings, mountains and other 3D objects in the water by setting view.environment.lighting.waterReflectionEnabled to true. Other properties such as setting the dominant color of the water, the strength of the wave, and the direction of the waves can add to this realistic visualization of water.
Integrated mesh modifications
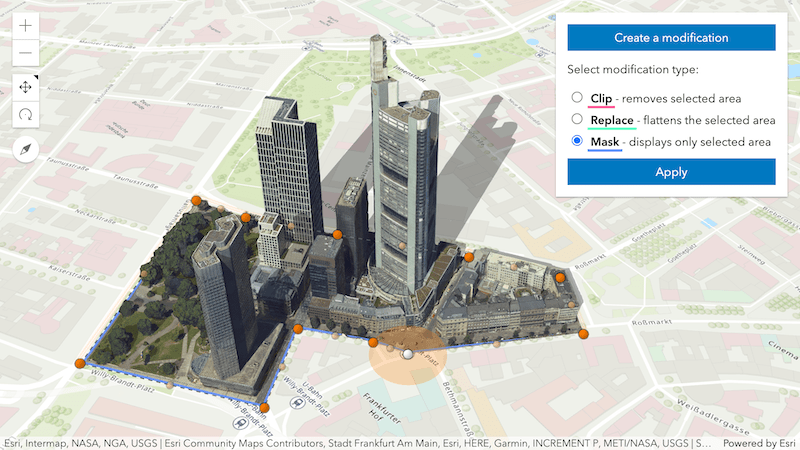
Change the shape of an IntegratedMeshLayer by applying client-side modifications. A new class SceneModifications allows you to change aspects of an integrated mesh in the following ways:
- Replace parts of the mesh with other 3D data such as buildings. One example of when this can be very useful is in urban planning scenarios.
- Mask the mesh to a desired shape (remove unwanted parts).
- Temporarily push down the mesh in “excavation-like” scenarios.
SceneModifications can be persisted using WebScene.save(), allowing users to share their modified integrated mesh through web scenes.
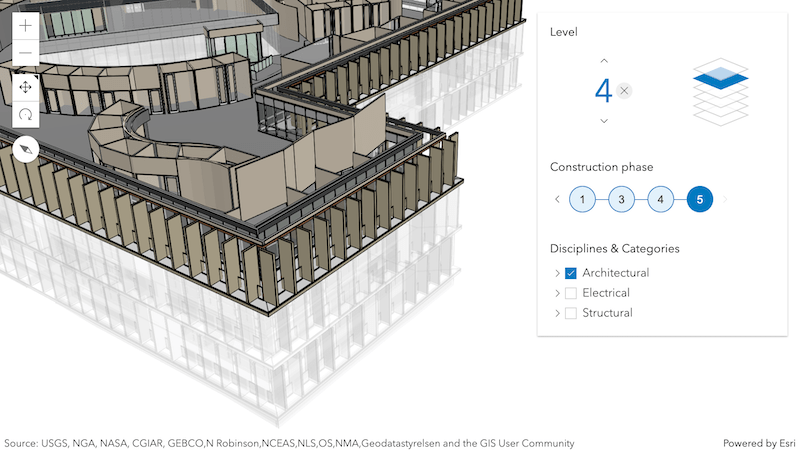
New Building Explorer widget
Better understand comprehensive building data coming from building information models (BIM) using the new Building Explorer widget. A preconfigured and intuitive UI allows you to isolate specific levels, categories, or construction phases for one or multiple buildings in your scene.
You might recognize this widget from the Scene Viewer – now that it is part of the API, you can create a similar experience in your app, or customize the UI for your specific BIM workflows. The widget provides simple options to toggle the UI components’ visibility.
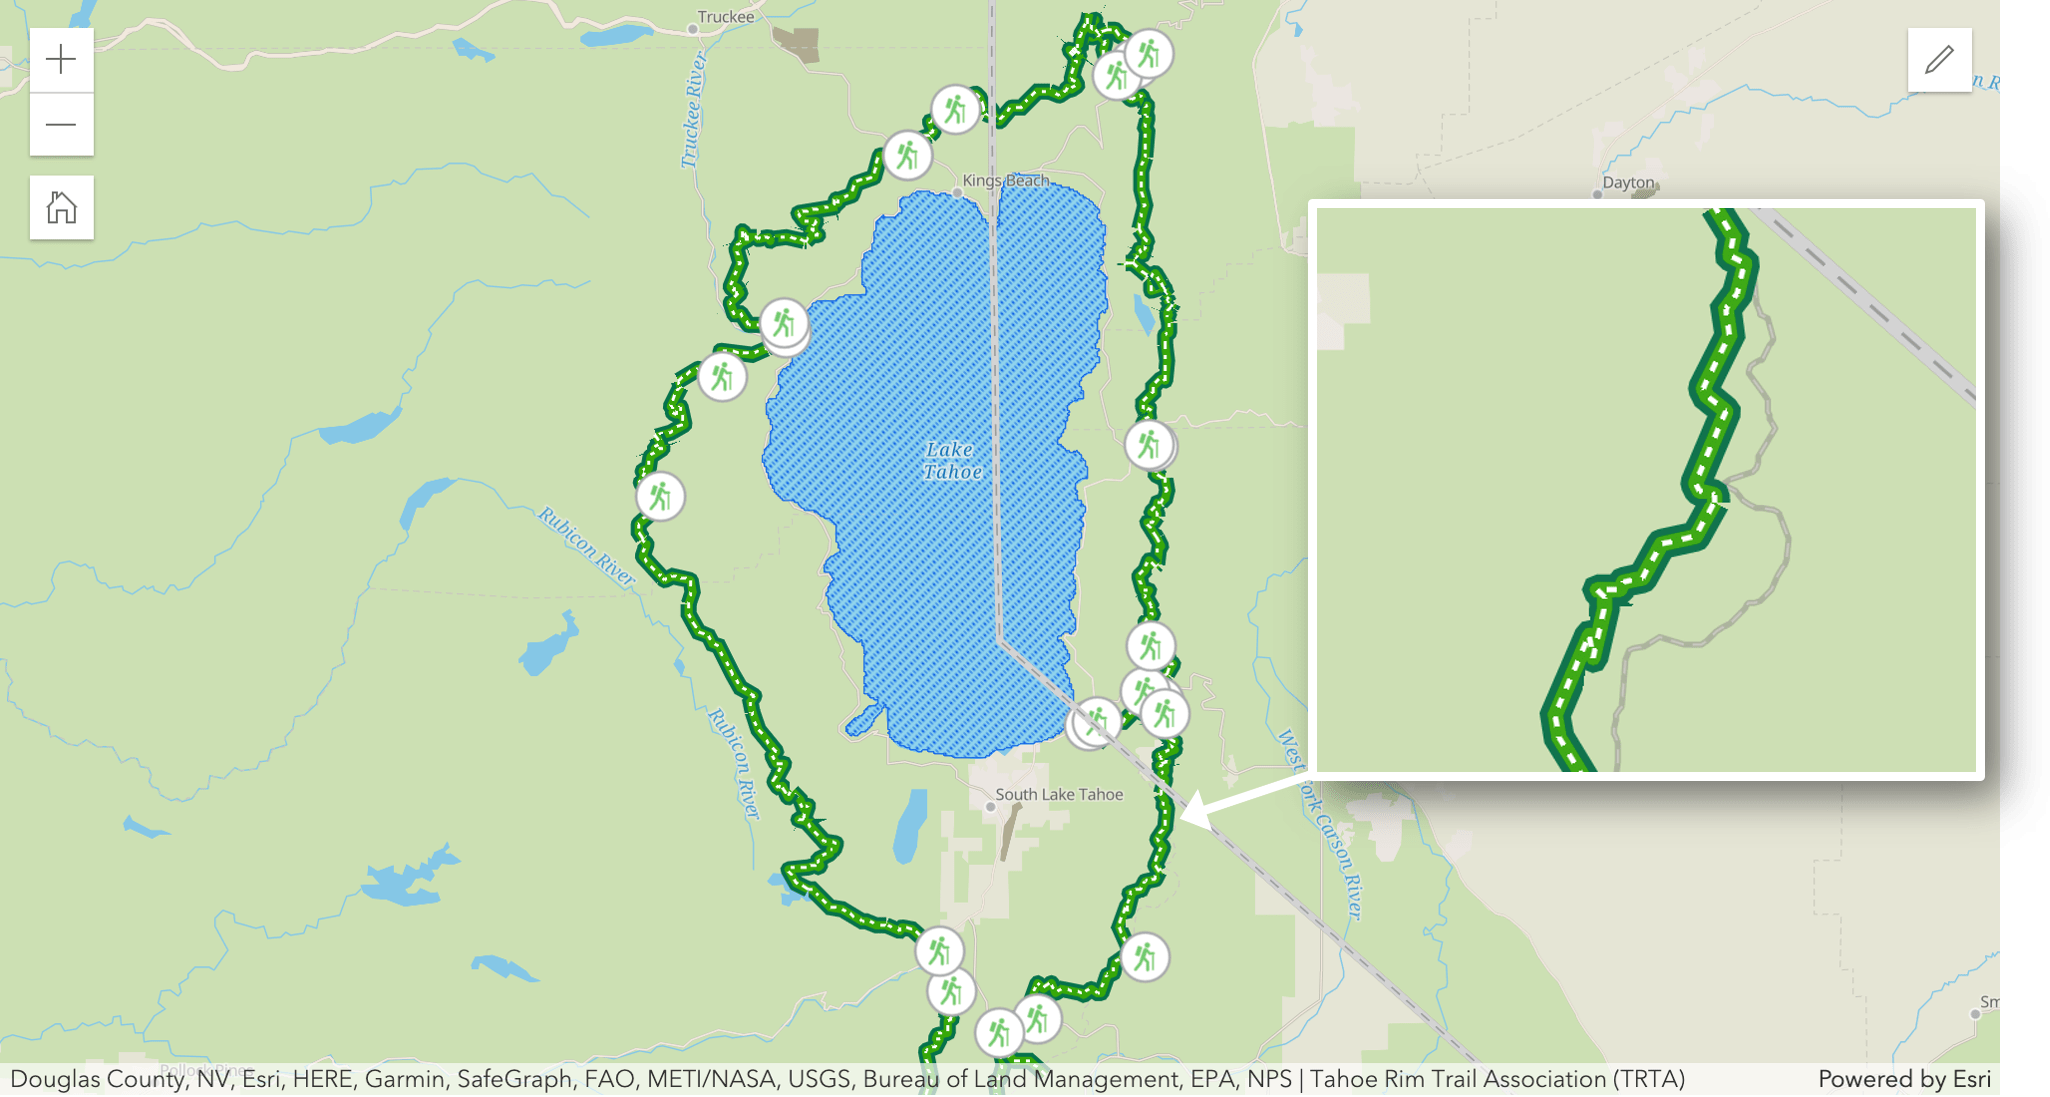
Line and polygon vector CIM symbols
We introduced vector symbology for 2D maps at version 4.12. This gave developers the opportunity to build beautiful maps that display crisp at any scale (see the comparison between a scaled image and a scaled vector symbol below).

Until now, only point symbols were supported. With this release, you can now display lines and polygons in 2D maps. This enhancement allows you to create multi-layered line symbols that allow you to represent cased roads, use custom line patterns, or place markers anywhere along your line. Under the hood this is powered by CIM (via the API’s CIMSymbol class), which is the ArcGIS platform’s cartographic information model. Symbols can have multiple layers which can be controlled separately and dynamically, using expression logic and feature attributes.
Support was also added for reading and writing CIM symbols in web maps.
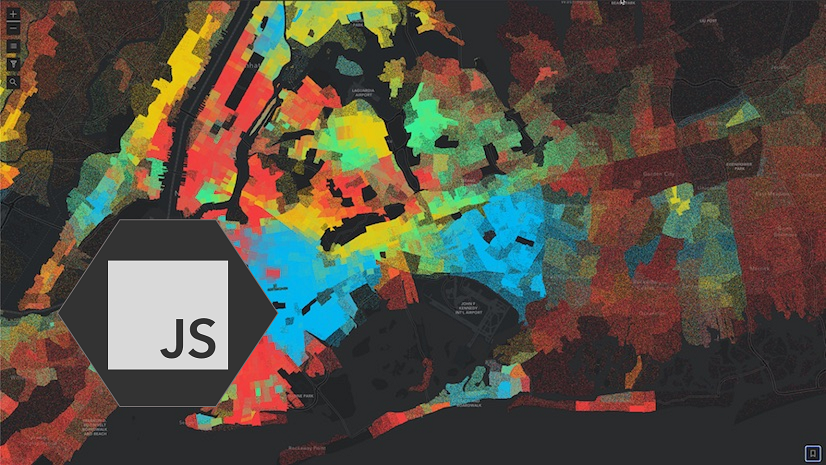
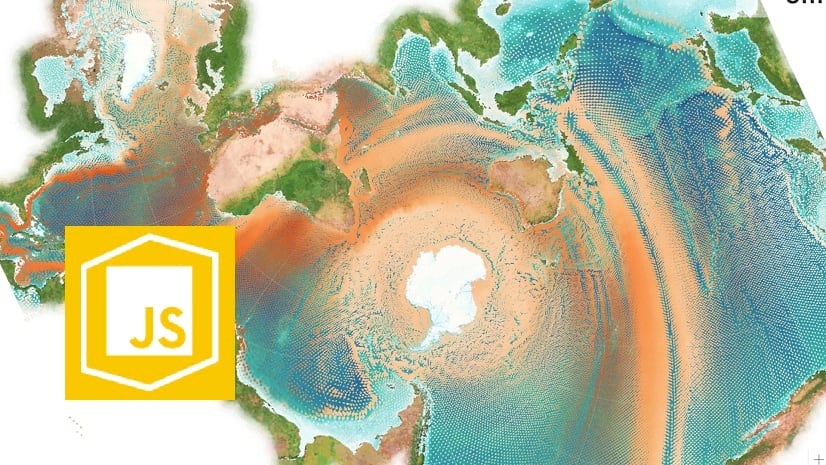
Powerful client-side capabilities for imagery
Advances have been made in the API in versions 4.15 and 4.16 to enable you to leverage the power of the client for imagery. In the past, imagery projection and rendering were performed on the server and delivered to the client as JPEG/PNG images for display. The new ImageryTileLayer allows you to perform client-side rendering of raster data, and dynamic capabilities such as:
- Client-side projection of raster data delivered as tiles.
- Visualize terrain in a 2D map and even apply a shaded relief using the new RasterShadedReliefRenderer (available for both tiled and dynamic imagery layers).
- Fetch raw pixel data given an extent: Pixel access provides a gateway to go beyond visualizing imagery, such as interactive charting, local statistics.
- Dynamically change the renderer (unique value, stretch, class breaks) for Imagery Tile Layers on the client.
- Support for Imagery Tile Layers in both 2D maps and 3D scenes.
Editing in feature tables (beta)
We’ve added editing support to the FeatureTable widget. If the feature service that the table is displaying data for has editing enabled, and the feature table’s editingEnabled property is set to true, end users will be able to edit their attribute data by double-clicking a cell.
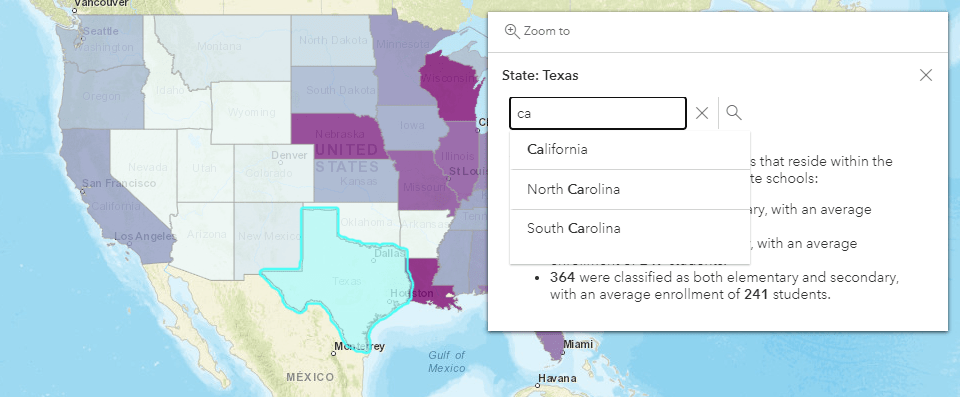
Popups: Add custom content
Now, in addition to fields, media, text, and attachments, you can embed just about anything inside a popup element called CustomContent. This type of content element can work with content such as strings, HTMLElements, Widgets, and/or a Promise.
How does it work? A PopupTemplate formats and defines the content of a popup for a specific Layer or graphic. You can specify any combination of popup elements that you want to display in the content section of the popup when the user clicks on a feature such as formatted attribute information, a chart, and your custom content like a button or API widget.
API Modernization
At the 2020 Esri Developer Summit, we announced that we are working to modernize how the ArcGIS API for JavaScript is consumed for seamless integration with frameworks and developer tooling. As part of this project, the following updates are included in version 4.16:
- The API no longer has dependencies on Dojo.
- We developed a new solution to localize the API’s widgets to replace dojo/i18n.
- The API returns native promises.
- Classes are now using native class syntax instead of dojo/_base/declare. See the release notes for more details about this change, or learn how to implement classes using this guide.
Keep your eyes peeled for an upcoming blog all about API modernization.
IE 11 and Edge Legacy Deprecated
Internet Explorer 11 is now deprecated at version 4.16 of the JavaScript API. It is also being deprecated in other parts of the ArcGIS platform; for example ArcGIS Online and ArcGIS Enterprise have announced the deprecation of IE11 and Edge Legacy along with an end of support date in ArcGIS Online by the end of 2020. Users are highly encouraged to move to a modern browser such as Mozilla Firefox, Google Chrome, Apple Safari, or Microsoft Edge. While Internet Explorer 11 continues to be supported, use of Internet Explorer 11 is discouraged, and support will be discontinued at a future release. Additional notice will be provided prior to the removal of support.
There’s a lot more to this release
There is a lot packed into this release. Several other enhancements can be explored in the release notes, such as:
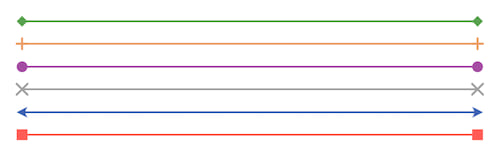
- The ability to have arrows, diamonds, crosses and other markers at the beginning and/or end of SimpleLineSymbols in a 2D MapView.
- When saving web maps, you can now save more initial view properties, including the extent, rotation, and scale.
- Gather insights on the performance and memory consumption of layers in your 3D scene using a handy property called performanceInfo. A new sample illustrates how you can use the property to better understand the amount and complexity of visualized data in your scene.
- A new widget called TableList that is very similar to LayerList, but is used for displaying a list of tables.
Join us at the virtual 2020 Esri User Conference!
The 2020 Esri User Conference (Esri UC) is a completely virtual event designed to give users and students an interactive, online experience with Esri and the GIS community. There will be multiple ways in which to engage with the ArcGIS API for JavaScript development team including Streaming live technical sessions with Q&A, a virtual showcase with one-on-one meetings and chat rooms. Our team has put together a collection of presentations that cover best practices and explore some of our latest innovations for building powerful and engaging web apps with the ArcGIS API for JavaScript. Check out this virtual tour of the UC for web developers.
Did you know? You can get access to the full conference if you are part of an organization that is current on a maintenance plan or subscription, including users with ArcGIS for Personal Use licenses, distributors and partners. If you are a current student or 2020 graduate, you can see the plenary, and all the presentations. Register here.
Take care and stay healthy, web developers!


Article Discussion: