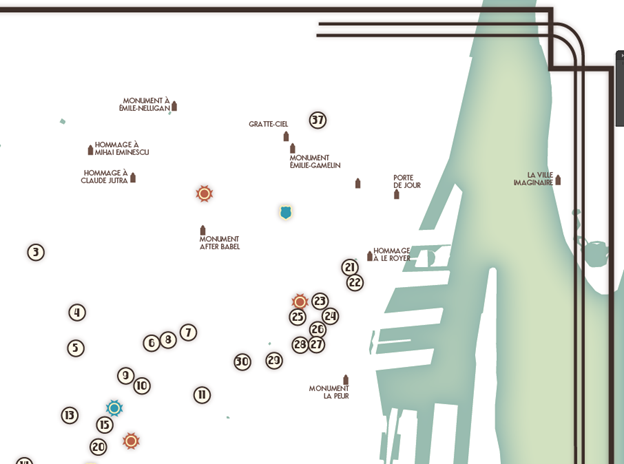
A few weeks ago, I had the pleasure of attending the annual North American Cartographic Information Society (NACIS) conference. This year’s conference was held in Montréal. For one of my presentations, co-presented with Clint Loveman, I demoed how to make this art deco-themed map using the ArcGIS Maps for Adobe Creative Cloud extension (M4CC) inside of Adobe Illustrator. This post describes some useful information for constructing a map like this one.

1. Dissolve big datasets that don’t need attributes for final output
Some cities make finding their building footprint data very easy. For other cities, it is a little more challenging. This is when I like to use OpenStreetMap, which is crowdsourced geographic data available to members within the Open Database License. For this Montréal map, I used OpenStreetMap building footprint data (.osm), which was converted into a .shp file.
While I only mapped the area surrounding the NACIS 2017 conference, that is still a lot of building footprints! A row created for each one of these buildings can be pretty heavy, and since I knew I was only going to be using the the footprints as a visual backdrop, it was not important to keep the heavily attributed information for each building footprint. For the purpose of simplification and data size reduction, I performed a dissolve function on the .shp file, not specifying any field upon which to dissolve. Doing so gave me a simple .shp file that contains all the footprints in my map’s extent in one single row in the database.
The reason for simplifying data like this is twofold: 1) You will shorten the load time of your file to the Illustrator extension; 2) Your map download/sync time will be improved as well.
2. Use those incredible KML files!
While you cannot add raw KML files to the M4CC extension, there are still ways to use them. The web is full of really great user-generated KML files, including yours! All you need to do is convert the KML/KMZ file to a Comma Separated Value (CSV) file, or convert it to a feature class or .shp file, and you’ll then be able to load it into them to your map easily. There are several resources online for converting a KML file to a CSV file, and there is a conversion tool for KML files in ArcMap and ArcGIS Pro.
The location of art deco buildings started out as a KML file from a map created and curated by the Art Deco Society of Montreal. So all the credit for the art deco building locations goes to this wonderful resource.
3. Use the app to leverage those custom Illustrator symbols
You’ve experienced the time it takes to manually replace map symbols in AI with your beautiful custom Illustrator symbols that you worked so hard on. But it doesn’t have to take so long! You can replace map symbology with the M4CC tool automatically with one simple step. For this art deco map, I created an AI symbols library that contained a symbols for fire stations, police stations, emergency medical stations, a circle symbol for the background of the art deco building symbol, and monuments. In total the amount of symbols is around sixty. Manually dragging and dropping each symbol to the map, and then deleting the original symbol would be somewhat time consuming. It doesn’t take a vivid imagination to picture a scenario with hundreds of symbols that need to be replaced. Using the Custom Symbols option in the Settings tab of the M4CC extension can save you a ton of time, while still giving you full creative control over the appearance of your map. See the Maps for Creative Cloud Help for instructions on how to set up custom symbol replacement.
4. Categorize with ArcGIS Online tools
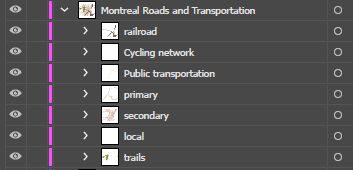
The M4CC extension gives you access ArcGIS Online smart-mapping tools, which provide a lot of geo-data visualization capabilities. This Montreal art deco map doesn’t have a lot of what can be considered data visualization, however all maps are a form of data visualization. I used the smart mapping tools to categorize the roads by type so that they would appear in separate categories as neatly organized sub-layers in the Illustrator Layers panel. This allows me to globally style each category accordingly. Categorization within the extension makes this possible.

Commenting is not enabled for this article.