The first time I had to make a map it was for a resource guide for students in my university art department. It turned out all right, but it took me longer to create that map of 15 point locations than the rest of the 22-page guide. Unfortunately, the lesson you might take from such an experience is “Don’t make a map. It’s too much work. Your project does not need a map that badly.”
Well, that was back in the day. Back in the day we didn’t have ArcGIS Maps for Adobe Creative Cloud. Now you can access and create geographic data from within Adobe Illustrator or Photoshop. You can style, label, and analyze it. You can add legends and projections. No more time-consuming hacks like tracing screenshots from Google Maps, or hand-placing hundreds of locations. The fact is there are tons of people out there mapping the world for you. And you can reap the benefits of their good work in your good design.
In this blog I’m going to walk you through making a walking tourist map for a fictional hotel in Rockland, Maine—The Oceanland Inn. I was recently in Rockland, and it was beautiful. And now that I have this handy map, I can’t wait to go back.
This tutorial was tested and updated on October 27th, 2022 with ArcGIS Maps for Adobe Creative Cloud version 3.3.

Set up a mapboard
1. Download and install the ArcGIS Maps for Adobe Creative Cloud plug-in and open Adobe Illustrator.
2. Click Window, point to Extensions, and choose ArcGIS Maps for Adobe Creative Cloud.
The Sign In window appears.
3. Sign in with either a Plus, ArcGIS Online, or ArcGIS Enterprise account.
If you don’t have an account, you can sign up for a free trial.
Two windows appear: ArcGIS Maps: Compilation and ArcGIS Maps: Mapboards. One of the windows may be hiding the other.
4. On the Mapboards window, search for Rockland, Maine.

5. Click Draw.

6. Drag a box around the coast of Rockland Harbor. Don’t worry about getting it perfect; you can adjust it later.

The Mapboard Options window appears.
7. For Name, type Rockland.
You can specify either a size or a scale for your map. The owner of the Oceanland Inn wants to print the map as a postcard-size handout that she can give to guests. So for this project, you’re going to start with a size.
8. For Width, type 4 in. For Height, type 6 in.
Tip: If your units are in millimeters or another unit, you can still type measurements followed by “in” to specify that they are in inches. The values will automatically recalculate to convert them to millimeters.

The Level of Detail is calculated based on how much land is currently covered by your 4- by 6-inch mapboard.
9. Click OK.
10. Hover over the mapboard. The Move button appears. Use it and the handles on the edge of the mapboard to reposition and resize the mapboard until it is placed nicely over Rockland’s downtown.

11. When you’re ready, click Preview and add content.

The Compilation window appears. This is where you will add layers for your map. If the Introducing mapping profiles window appears, click OK.
Find the location of the Oceanland Inn
The first thing you need to add to your map is the location of the hotel.
1. Click Add Content at the top and choose Add Places.
2. In the Add Places window, in the search bar, type Beech and Lincoln and press Enter.
3. Click the Add button next to Beech St & Lincoln St, Rockland, Maine, 04841.

4. Click Close.
A dot appears on your map, and a new layer, named Beech and Lincoln, appears in your Contents list.
Visualize travel times
The hotel owner wants the map to show guests how long it will take them to walk to nearby places. Next, you can analyze the hotel location to define walk-time areas surrounding it.
1. Point to the options button next to Beech and Lincoln and choose Visualize Travel Times.

The list of layers is replaced by the Visualize Travel Times pane.
2. Change Measure to Walking Time.
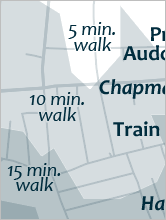
3. Replace 5 with 5 10 15 and make sure the time unit is set to Minutes.
Separating the numbers with spaces will generate a travel time area for each one, like concentric circles.
4. For Result layer name, type Walking Time.
5. Click Apply.

It may take a few minutes for the process to complete, but when it’s done, three purple polygons appear on the map.

6. At the bottom of the Visualize Travel Times pane, click OK to commit this change to your map.
Add locations from a file
Next, you want to show your guests what attractions exist within easy walking distance. Rockland is full of art galleries, parks, museums, and marinas. Fortunately, the hotel owner has already provided you with a list of the places she wants to see featured on the map.
1. Download RocklandPlaces.csv. This file contains three columns: Name, Address, and Type.

2. Click Add Content and choose Add Layer from File.
3. Browse to and select RocklandPlaces.csv and click Open.
A collection of points draw on the map.
Tip: If some of the places are cut off by the extent of your map, you can move and resize the mapboard in the Mapboards window. The map in the Compilation window will follow.
4. In the Contents list, next to RocklandPlaces, point to the options button and choose Manage Labels.
5. Change the font size to 10. For Alignment, choose the middle option. Check the Show overlapping labels box to ensure that no labels are left behind.

6. Click OK.

The labels are all in a jumble. That’s okay. You’ll rearrange them later.
Symbolize your map data
Next, you’ll symbolize these points based on their type.
1. Next to RocklandPlaces, point to the options button and choose Change Style.
2. Under Choose an attribute to show, choose Type.
3. For Select a drawing style, make sure Types (Unique symbols) is selected.
4. Click Options.
")
5. A different color has been assigned to each location type. You can change these default colors later using the Illustrator tools you’re used to. But if you want to change the default symbols now, click them one at a time.

For the example map, I went with a monochromatic blue color scheme. All of my symbols have a dark blue (#002C3D) fill and white outlines. And instead of using four categories, I narrowed it down to two. I made indoor things (museums and public services) circles, while outdoor things (parks and marinas) are diamonds.

6. When you are happy with your symbology changes, click OK to commit them to your map.
Change the PPI
At the top of the Compilation window, you can see that the PPI is set to 96. That’s fine for the web, but these maps are going to be printed.
1. Change PPI to 300.

Now the detail on your basemap has changed. That’s okay because you’re not going to keep it.
2. In the Contents list, next to Topographic, point to the options button and choose Delete.

Add map data
Next, you’ll add some more layers to replace the basemap.
1. Click Add Content and choose Add Layers.
2. Under ArcGIS Libraries, click Living Atlas of the World.
3. In the Search bar, type watershed boundaries and press Enter. In the results, click the Add button on Watershed Boundaries.

4. Click Close.
Nine layers were added to your map, and this is more than you need.
5. Delete all layers except for Watershed Boundaries – WBDLine.
This layer provides you with a detailed coastline, which you can later use to color in the ocean.
6. Turn on visibility for the remaining Watershed Boundaries layer.

Two green lines appear on the map: one delineates the coastline and the other is a watershed boundary that you’ll delete later.
7. Reopen the Add Layers window.
8. Under ArcGIS Libraries, choose Living Atlas of the World and search for USA roads.
9. Add the layer USA Roads and click Close.
Another layer is added to the map. You now have all the data that you need to design a tourist walking map for the Oceanland Inn.

Just as you did for the RocklandPlaces layer, you can resymbolize the other layers using the Change Style option before syncing your map. However, this is not necessary; you can also make symbology changes later, using the Illustrator tools you’re used to.
Sync your map
You are now ready to sync your map into an Illustrator document. Don’t worry if you’ve forgotten something; you can always come back and resync it later.
1. In the Contents list, make sure that all of the layers that you want in your map have arrow symbols next to them.

Any layers without this icon will not be synced.
2. At the top of the Compilation window, click Sync, and in the Sync Map window, click OK.

3. Wait for your map to finish constructing.
If you get a warning about missing fonts, click Close to dismiss it. You’re going to be replacing the default font anyway.

Style the map in Illustrator
This part is all up to you. As previously mentioned, I chose to make a monochromatic map, as is all the rage these days. You may have a different color scheme in mind.
Your new map document has a layer list already broken up into groups to represent all the parts of your map. Partially collapsed, that list looks like this:

1. Turn off the Rockland_Elements group layer. This group contains the Esri logo and data copyright information. You’ll work that into some credit text later.
2. Select the Labels group layer and in the Properties pane, change the font. I recommend Candara Bold 11 pt.

3. Select the background group layer to the bottom and give it a fill color. I used the blueish-gray #99ABB1.
4. Select the background path and the coastline path. Use the Pathfinder Divide tool to split the rectangle into two parts—one for land and one for water.

5. In the Layers list, expand the Watershed Boundaries layer to find the shapes you just made.

6. Name the two new Paths Ocean and Land and delete the remaining path.
7. Give the ocean polygon a dark blue color—perhaps the same #002c3d as the point symbols—and remove the strokes from both polygons.
8. In the Layers list, delete, rename, regroup, and rearrange the layers to match your desired drawing order. My list looks like this:

9. Save your project.
Now that you have everything in order, it’s time to make the map shine. These design decisions I leave to your own good judgement. Below are a few suggestions:
Map text
Lettering your map is often the most time-consuming cartographic task, and the easiest way to make or break a map.
- In this particular map, it may seem difficult to fit in all those labels. Don’t be afraid to add leader lines and halos:

- I also chose to differentiate my labels subtly, which can help with legibility on crowded maps. In this case, labels for outdoor things are in italics.
- Don’t forget to add a map title, a label for the hotel, and text that explains the walk-time polygons.
- You also need to add credit text to acknowledge your data sources. You can find the data sources in the Copyright text inside the Rockland_Elements layer.
Map legends
I felt that I did not need a legend on this map, since everything was explained through labels. But if you want to add one, reopen the Compilation window.
1. Open the Processes window.

2. Check Map Legend box and click Create Legend.

A new group layer will be added to your Illustrator document with a ready-made legend.
Your map is complete! You didn’t have to trace the coastline or roads from an aerial photo or another map. You were able to add locations using a simple text file, and you didn’t need to time yourself walking from the hotel to the Lighthouse Museum. And now guests at the Oceanland Inn don’t need to call an Uber. It’s a win-win.

Commenting is not enabled for this article.