The November 2026 update to ArcGIS Dashboards in ArcGIS Online continues to evolve the dashboard experience with new capabilities for authors and viewers.
At the center of this update is context. New ways to explore and interact with your data will help reveal patterns, make information easier to understand, and create dashboard experiences that communicate more than what’s happening at a glance.
Let’s dive right into the key features:
- Calendar heat chart
- Histogram chart
- Support for Parquet feature layers
- Arcade assistant
- Other Improvements

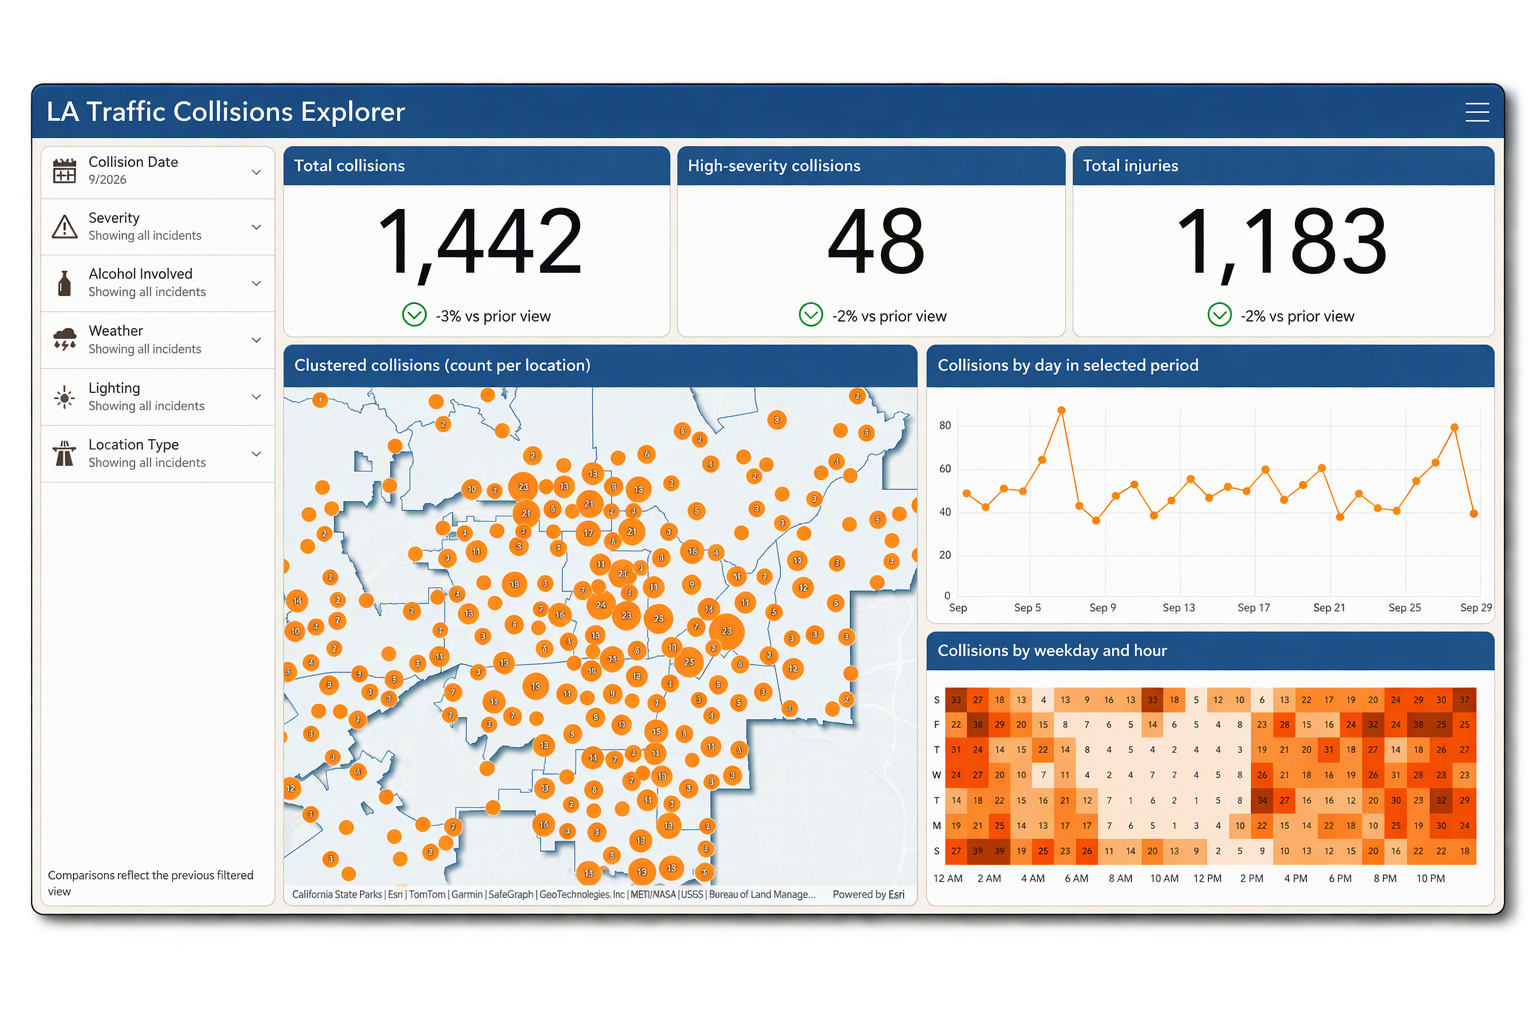
Discover when activity happens with a calendar heat chart
New in this ArcGIS Dashboards update, calendar heat charts make it easier to uncover patterns and trends in time-based data.
Use color to show activity intensity across two calendar-based time dimensions, and quickly see when events happen most often. Explore combinations such as day of week and hour of day or month and year to identify busy periods, recurring patterns, and unusual activity at a glance.
Calendar heat charts work with temporal fields and support calendar unit extraction, time zones, and locales, helping you transform large volumes of time-based data into clear, easy-to-understand patterns. Whether you’re analyzing incidents, service requests, traffic activity, or other events over time, calendar heat charts help you quickly focus on when activity is highest and where patterns deserve a closer look.
Add a calendar heat chart to your next dashboard to uncover recurring patterns, pinpoint peak activity, and turn time-based data into actionable insights for your audience.

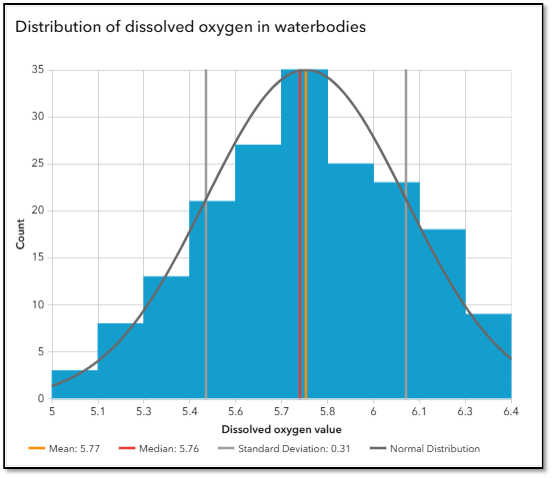
Explore the distribution of your data with a histogram chart
Get a clearer picture of your numeric data with the new histogram chart, which shows how values are distributed and where they tend to fall.
Values are grouped into ranges, or bins, and each bar’s height shows how often values fall within that range. This makes it easy to see your data’s overall spread and quickly spot concentrations, peaks, clusters, and potential outliers that may be hard to identify from individual values alone.
Whether you’re exploring response times, asset measurements, service durations, or other continuous numeric data, a histogram chart helps turn large datasets into patterns you can understand at a glance.
Add a histogram chart to your next dashboard to uncover how your values are distributed, reveal patterns that might otherwise go unnoticed, and give your audience a clearer picture of what the data is telling them.
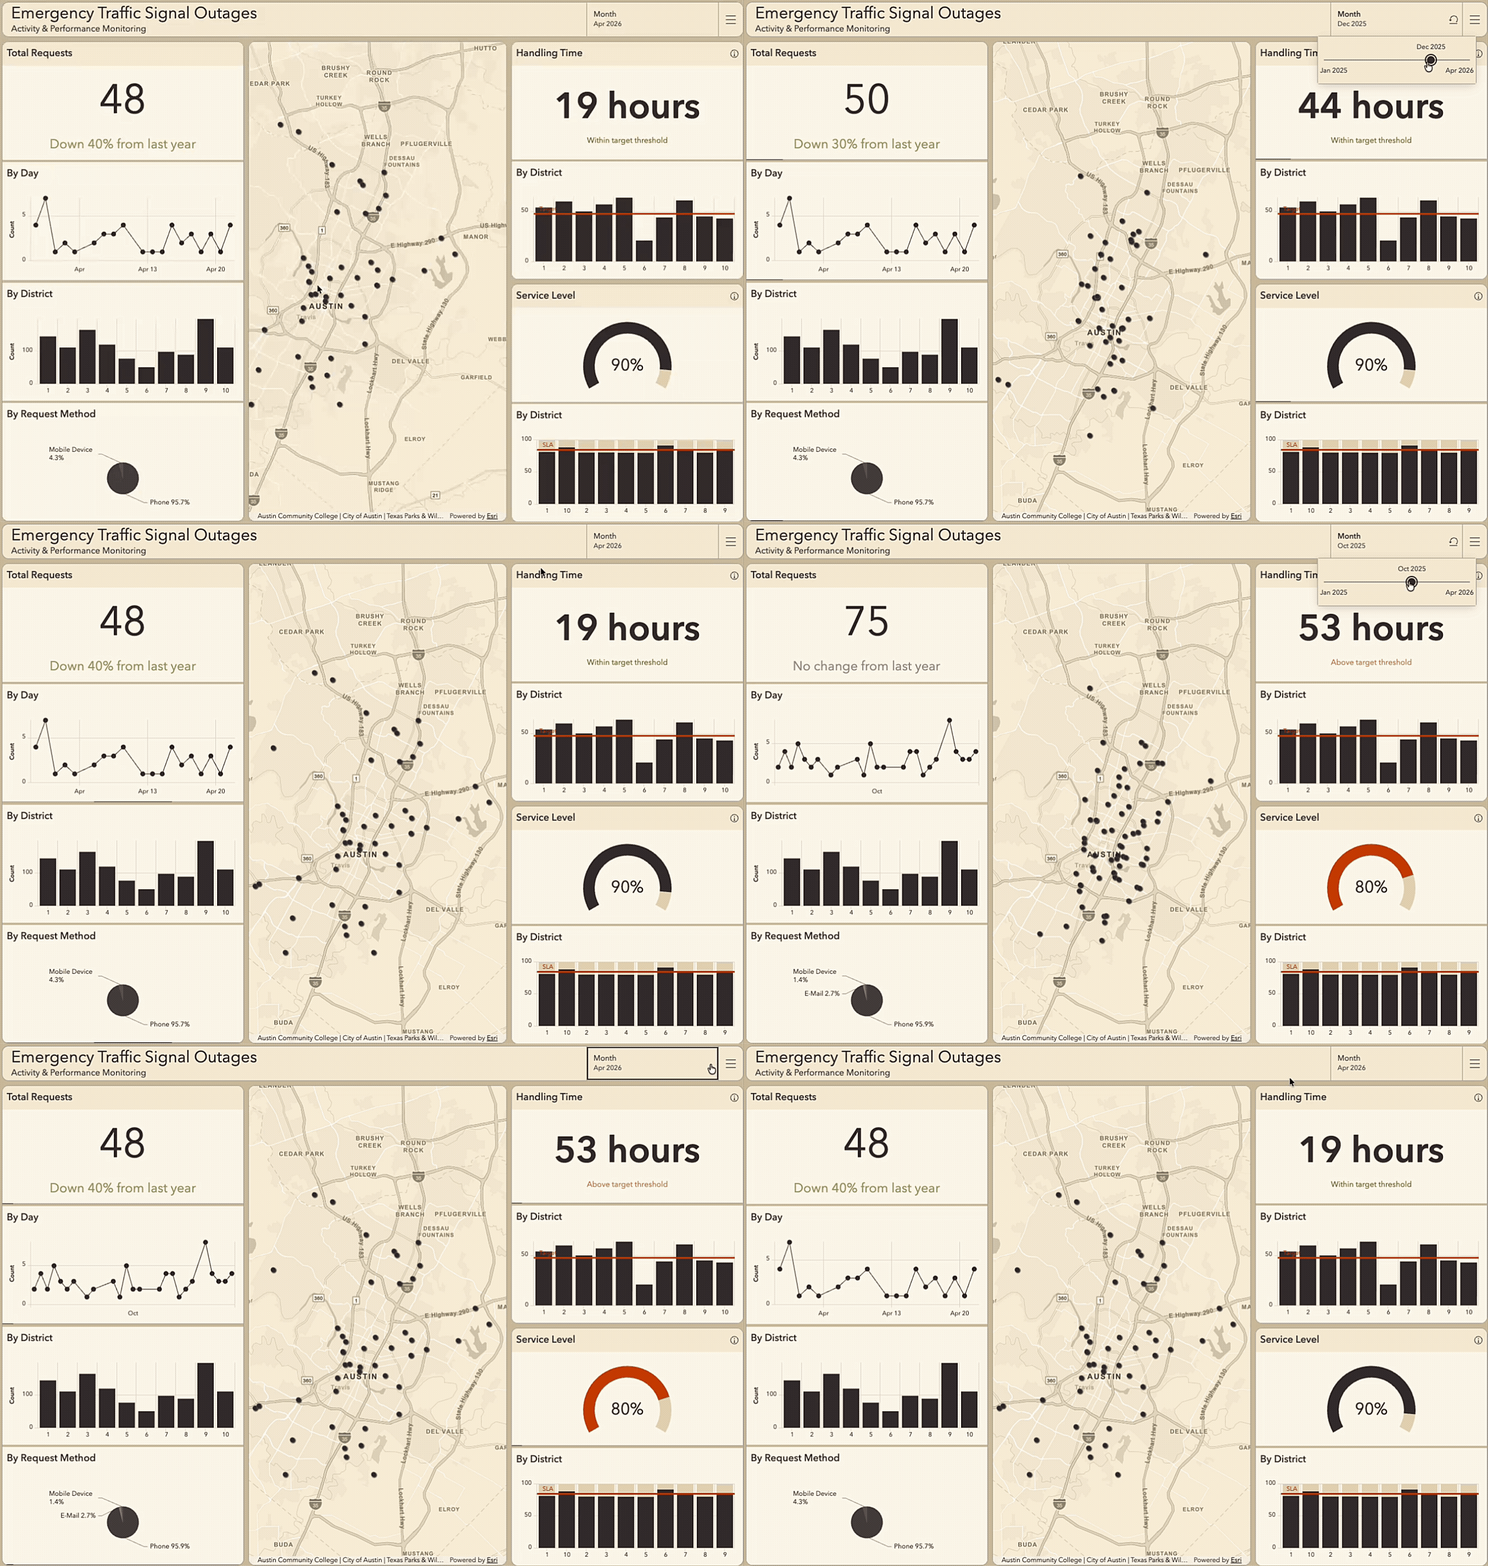
Bring large spatial datasets into focus with Parquet feature layers
ArcGIS Dashboards now supports Parquet feature layers from web maps, giving you more flexibility when building dashboards with hosted spatial datasets.
Display features on a map and use Parquet-backed data in supported dashboard workflows, including summary statistics, categorical aggregations, time-series visualizations, and interactive experiences. Spatial optimizations help make Parquet feature layers well suited to visualizing large geographic datasets, while the layer type remains in beta.
Whether you’re working with extensive asset inventories, building footprints, administrative boundaries, or other large datasets, you can bring that information into a connected dashboard experience that helps viewers explore patterns and understand what is happening.
Add a Parquet feature layer to a web map and use it in your next dashboard to transform large-scale spatial data into focused, interactive insights.
Create and refine Arcade expressions faster with Arcade assistant
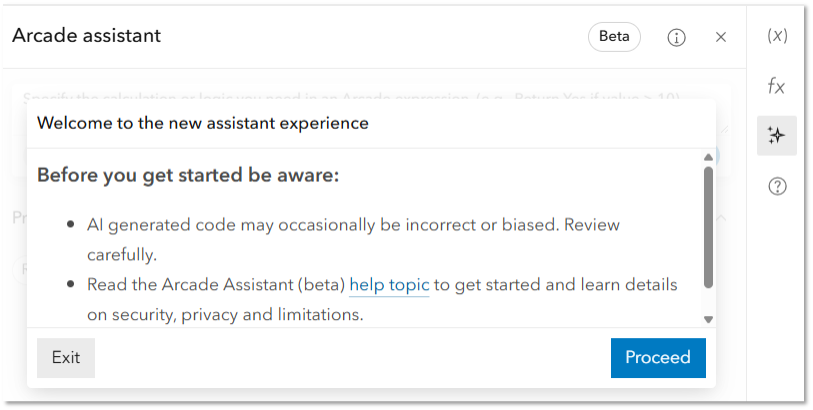
Create and refine Arcade expressions faster with the Arcade assistant, using natural language to spend less time writing and troubleshooting code.
Describe the result you want, then review, test, and refine the generated expression to reduce time spent writing and troubleshooting code while keeping you in control.
New in this update to ArcGIS Dashboards, the Arcade assistant is available for data expressions and in the advanced formatting editor for the List, Indicator, and Table elements, making it easier to prepare data and customize how information is presented in your dashboard.
Open the Arcade editor in your next dashboard and use the Arcade assistant to turn your ideas into expressions faster, then review and refine the results to create the experience your audience needs.
Improve table header readability with controlled line breaks
Table headers in ArcGIS Dashboards now support line breaks using <br>, giving you more control over how longer column headings are displayed. Add <br> where you want header text to move to the next line, helping you make better use of available space while keeping table headings clear and easy to read.
For dashboards that have not been edited since the previous release, existing line breaks are restored automatically, helping preserve established table layouts without additional authoring.
Start exploring what’s new!
Whether you’re just getting started or managing a large set of dashboards, this update gives you new ways to explore your data, work more efficiently, and communicate insights more clearly.
Ready to learn more?
- Explore the product release notes for details on the latest enhancements.
- Watch Best Practices for Designing Impactful ArcGIS Dashboards for practical dashboard design guidance.
- Join the Esri Community to connect with other users, ask questions, and explore additional resources.


Article Discussion: