We had a very busy Esri Developer Summit last week. It was great to meet and talk with many users about Operations Dashboard for ArcGIS in the exhibit showcase, after our technical sessions, and during the social events. There was a lot of great feedback, discussion, and questions.
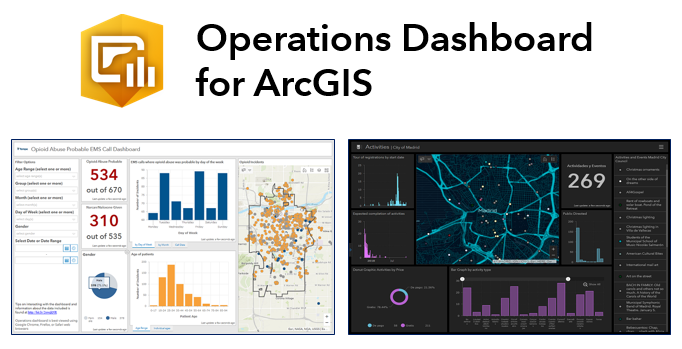
So, we wanted to share a quick recap of Operations Dashboard related events at Dev Summit and share some answers to some of the common questions we received throughout the week.
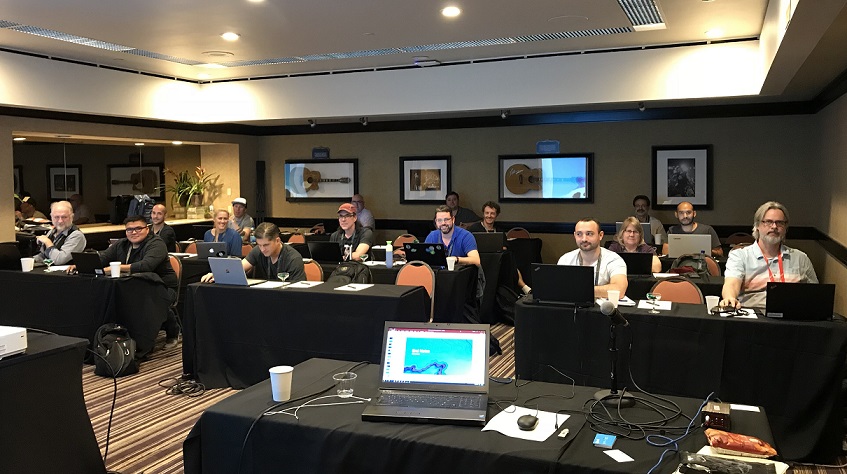
Operations Dashboard Pre-Conference Seminar
Attendees pre-registered and participated in a half-day event, where they rolled up their sleeves and were hands-on with Operations Dashboard, learning how to create effective dashboard apps. Instead of just using the maps provided, many participants applied the exercise materials to their own data and built some really nice dashboards in the seminar!
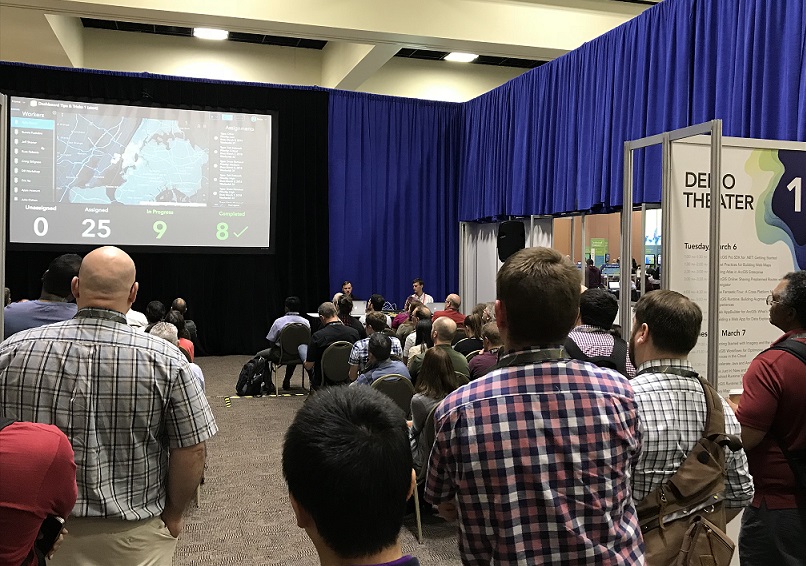
Operations Dashboard Tips & Tricks Demo Theater
This 30 minute session presented many best practices for configuring and designing efficient and effective dashboards. It was standing room only, as some attendees had to watch outside the theater seating area. Given all the interest and positive feedback, we will be publishing the content in a series of future blog posts.
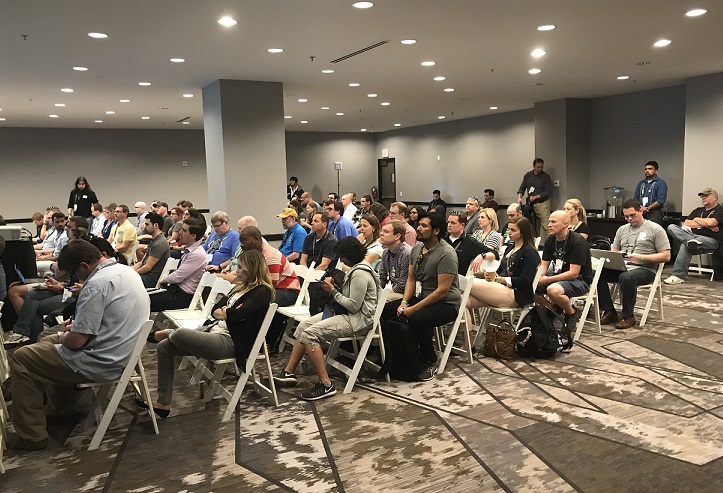
What’s New in Operations Dashboard Technical Workshop
This 1-hour session served as an overview of Operations Dashboard. Topics included a tour of the capabilities Dashboard offers, an exploration of the many visualizations that you can create, and how you can bring them to life with interactivity and selectors. As with the demo theater session, the room was completely full!
With all of the conversations at the conference, we wanted to highlight and share the top 5 questions that were asked about Operations Dashboard and how our team answered them:
Q1. How do I get the Operations Dashboard for ArcGIS app?
A1. Operations Dashboard is included with your ArcGIS Online organization at no additional cost. It is also available for ArcGIS Enterprise 10.6. For this release only, you will need to download a separate setup from the MyEsri customer download site that can install the web app on your 10.6 Portal. This setup is not available for older versions of ArcGIS Enterprise and with ArcGIS 10.6.1 and higher, will be included with all of the other configurable web apps.
Q2. Who is the target audience for Operations Dashboard for ArcGIS?
A2. The primary audience is a decision-maker within your organization. That could be the CEO of your company, a Commander or Section-Chief during an event, or perhaps a Project/Operations Manager. However, anyone in your organization or in the community that your organization serves can use dashboards. It is an effective presentation tool for visualizing key performance indicators. Also, Operations Dashboard is self-serving and easy to configure, so you don’t need a GIS expert to create and share dashboards.
Q3. How does Operations Dashboard for ArcGIS compare with Web AppBuilder for ArcGIS and Insights for ArcGIS?
A3. Operations Dashboard for ArcGIS is the premier app for creating sophisticated dashboard apps. It offers precision charting and visualization options and uses a new “dashboard” item type in ArcGIS Online and ArcGIS Enterprise 10.6.
Web AppBuilder for ArcGIS has a ‘dashboard’ theme layout option, where you can create a dashboard. You can use the Infographic widget to create simple charts and visualizations quickly and easily. You can also incorporate additional functionality such as editing and geoprocessing in your apps. Existing Web AppBuilder users will likely choose this option to create dashboards.
Insights for ArcGIS is designed for both spatial and non-spatial analysis and data exploration. The analysis results are displayed in maps, charts, and tables on a worksheet – these can be interpreted to be a “dashboard”, but not in the traditional sense. The distinction here: this app’s focus is for data discovery and analysis.
Q4. Does Operations Dashboard for ArcGIS work with Esri’s field apps (Collector for ArcGIS, Survey123 for ArcGIS, and Workforce for ArcGIS)?
A4. Yes, absolutely. Operations Dashboard can be thought of as the “monitoring app” for field workflow projects. The work assignments and field worker locations from Workforce for ArcGIS along with data captured and updated from the field with Collector for ArcGIS and Survey123 for ArcGIS can be displayed within a dashboard app in real-time.
Q5. What is the developer story for Operations Dashboard for ArcGIS?
A5. Operations Dashboard is a configurable web app and is not extensible and we do not have plans to provide a developer experience for Operations Dashboard. However, in the April release, we will support a new type of element called Embedded Content that will let you host documents, media and videos. If you find that the configurable experience of Operations Dashboard is not sufficient, please post details on the ArcGIS Ideas site.
For more information about Operations Dashboard, checkout these resources:
- Esri Live Training Seminar (1 hour) on Operations Dashboard for ArcGIS
- Blog: Some Example Operations Dashboard for ArcGIS Apps and Resources
- Operations Dashboard for ArcGIS help documentation
Sincerely,
The Operations Dashboard for ArcGIS Dev team

Commenting is not enabled for this article.