Most data and measurements can be associated with locations and, therefore, can be placed on the map. Using spatial data, you know both what is present and where it is. The real world can be represented as discrete data, stored by its exact geographic location (called “feature data”), or continuous data represented by regular grids (called “raster data”). Of course, the nature of what you’re analyzing influences how it is best represented. The natural environment (elevation, temperature, precipitation) is often represented using raster grids, whereas the built environment (roads, buildings) and administrative data (countries, census areas) tends to be represented as vector data. Further information that describes what is at each location can be attached; this information is often referred to as “attributes.”
In GIS each dataset is managed as a layer and can be graphically combined using analytical operators (called overlay analysis). By combining layers using operators and displays, GIS enables you to work with these layers to explore critically important questions and find answers to those questions.
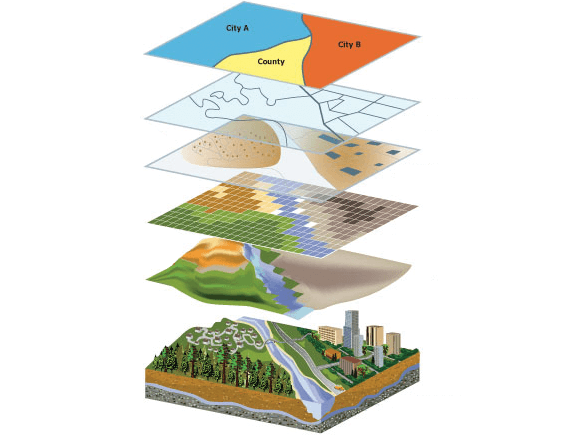
The idea of stacking layers containing different kinds of data and comparing them with each other on the basis of where things are located is the foundational concept of spatial analysis. The layers interlock in the sense that they are all georeferenced to true geographic space.
In addition to locational and attribute information, spatial data inherently contains geometric and topological properties. Geometric properties include position and measurements, such as length, direction, area, and volume. Topological properties represent spatial relationships such as connectivity, inclusion, and adjacency. Using these spatial properties, you can ask even more types of questions of your data to gain deeper insights.
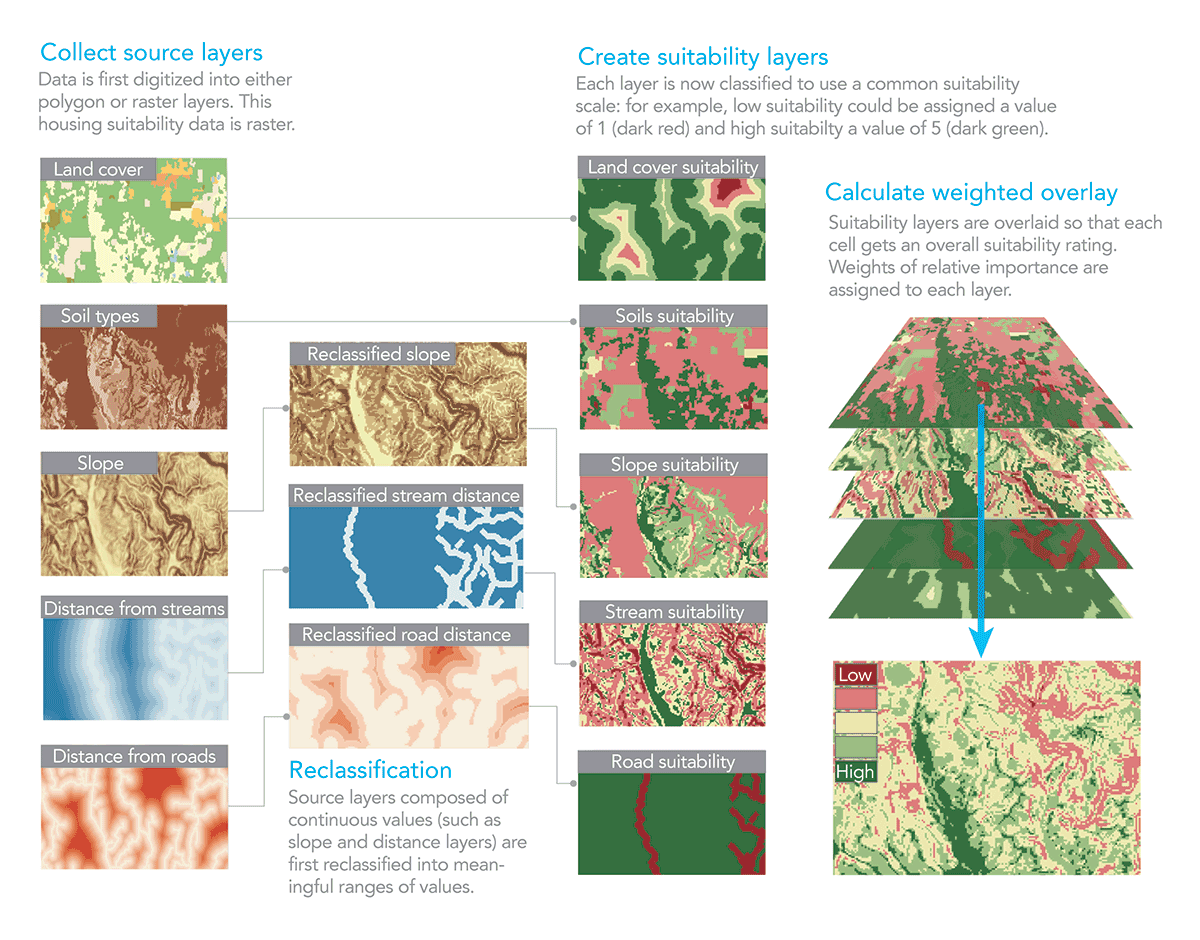
Anatomy of an Overlay Analysis
GIS analysis can be used to answer questions like: Where’s the most suitable place for a housing development? A handful of seemingly unrelated factors—land cover, relative slope, distance to existing roads and streams, and soil composition—can each be modeled as layers, and then analyzed together using weighted overlay, a technique often credited to landscape architect Ian McHarg.
Spatial Analysis
The true power of GIS lies in the ability to perform analysis. Spatial analysis is a process in which you model problems geographically, derive results by computer processing, and then explore and examine those results. This type of analysis has proven to be highly effective for evaluating the geographic suitability of certain locations for specific purposes, estimating and predicting outcomes, interpreting and understanding change, detecting important patterns hidden in your information, and much more.
The big idea here is that you can begin applying spatial analysis right away even if you are new to GIS. The ultimate goal is to learn how to solve problems spatially. Several fundamental spatial analysis workflows form the heart of spatial analysis: spatial data exploration, modeling with GIS tools, and spatial problem solving.
Spatial Data Exploration
Spatial data exploration involves interacting with a collection of data and maps related to answering a specific question, which enables you to then visualize and explore geographic information and analytical results that pertain to the question. This allows you to extract knowledge and insights from the data. Spatial data exploration involves working with interactive maps and related tables, charts, graphs, and multimedia. This integrates the geographic perspective with statistical information in the attributes. It’s an iterative process of interactive exploration and visualization of maps and data.
Smart mapping is one of the key ways that data exploration is carried out in ArcGIS. It’s interesting because it enables you to interact with the data in the context of the map symbology. Smart maps are built around data-driven workflows that generate intelligent data displays and effective default ways to view and interact with your information to see things such as your data’s distribution.
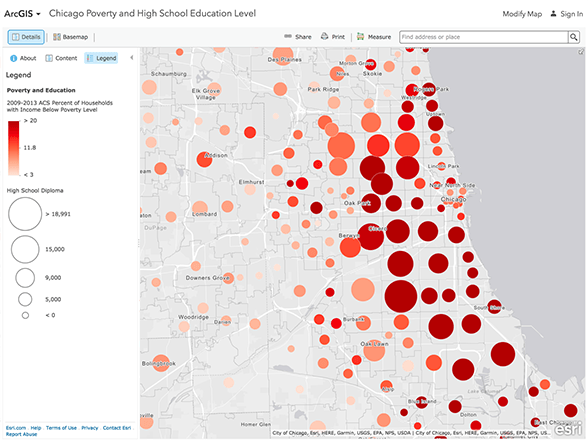
Smart mapping allows you to choose multiple attributes from your data, and visualize the patterns from each attribute within a single map using both color and size to differentiate (also referred to as bivariate mapping). This can be valuable for exploring your data, and allows you to tell a story using one map instead of many.
Combining Interactive Charts and Graphs with GIS Maps
Visualization with charts, graphs, and tables is a way to extend the exploration of your data, offering a fresh way to interpret analysis results and communicate findings. Typically you might begin by browsing through the raw data, looking at records in the table. Then maybe you’d plot (geocode) the points onto the map with different symbology and begin creating different types of charts (bar, line, scatter plot, and so on) to summarize the data in different ways (by district, by type, or by date).
Next, you can begin to examine the temporal trends in the data by plotting time on line charts. Information design is used to arrange different data visualizations to interpret analysis results. Combine a series of your strongest, clearest elements such as maps, charts, and text in a layout that you present and share.
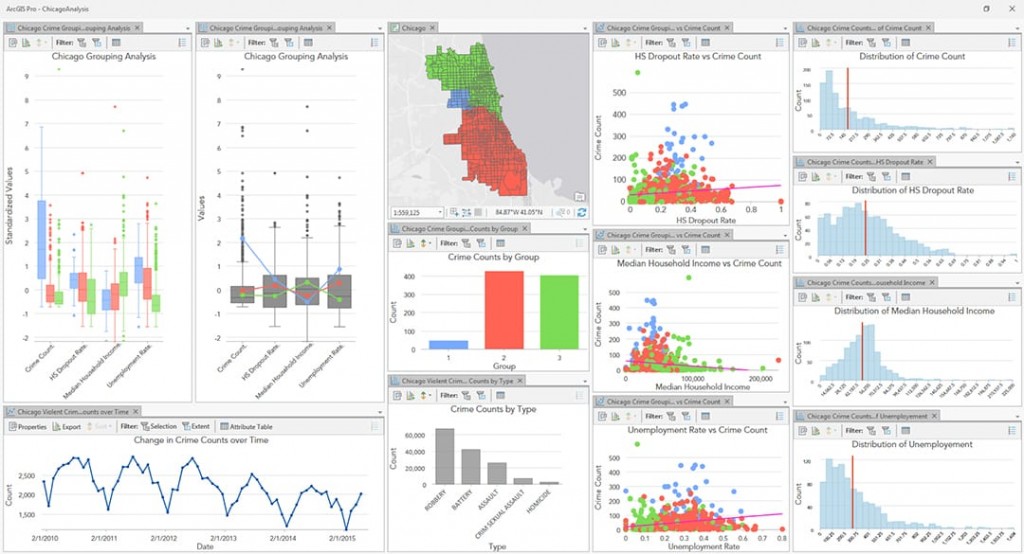
Finding the signal in the noise. Visualizing data through charts helps uncover patterns, trends, relationships, and structure in data that may otherwise be difficult to see as raw numbers. Depicting violent crime statistics from Chicago, a combination of chart and map styles work together to unlock patterns and meaning from what started out as pure tabular data.
—–
This post is excerpted from The ArcGIS Book, Second Edition: 10 Big Ideas about Applying The Science of Where, by Christian Harder and Clint Brown. The twin goals of this book are to open your eyes to what is now possible with Web GIS, and then spur you into action by putting the technology and deep data resources in your hands. The book is available through Amazon.com and other booksellers, and is also available at TheArcGISBook.com for free.
Commenting is not enabled for this article.