The end of the year is here and so is clustering! The latest release of the ArcGIS API for JavaScript includes many updates that you can start taking advantage of in your apps; for example point clustering for 2D, the ability to save and update web maps, new 3D client-side analysis tools for line of sight and displaying daylight and shadows, important performance enhancements, and much more. Continue reading for an overview of some of the highlights of version 4.14 or check out the release notes for all the details.
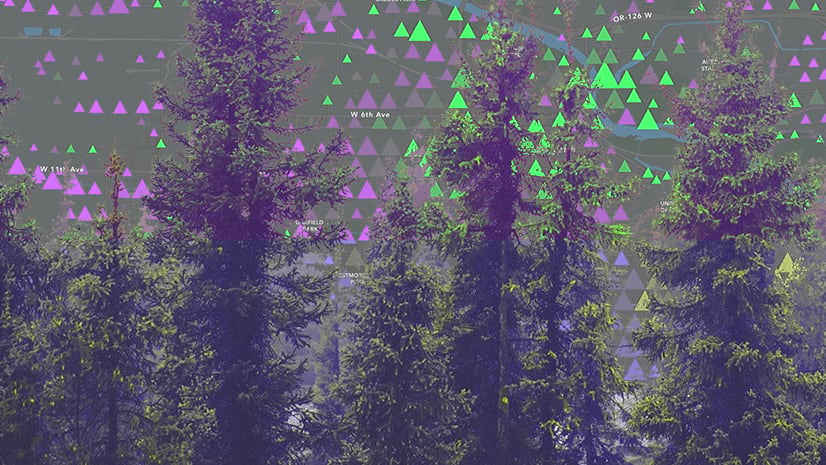
Clustering is here (in beta)!
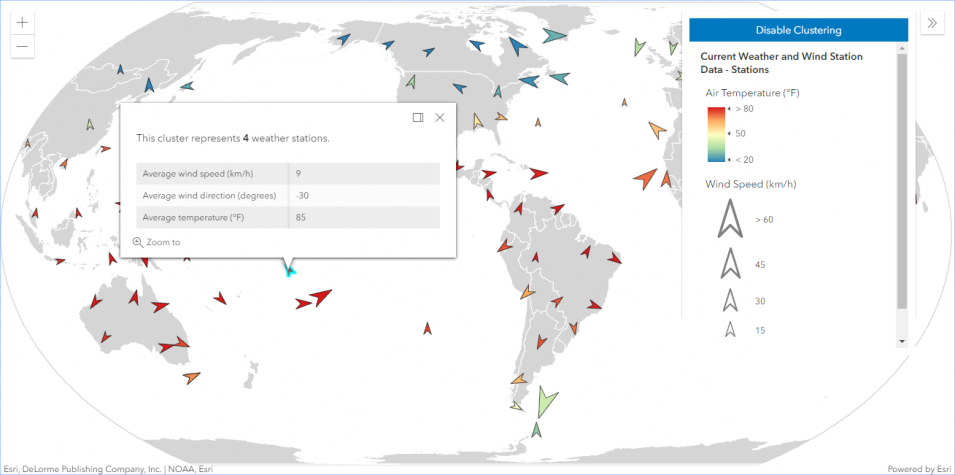
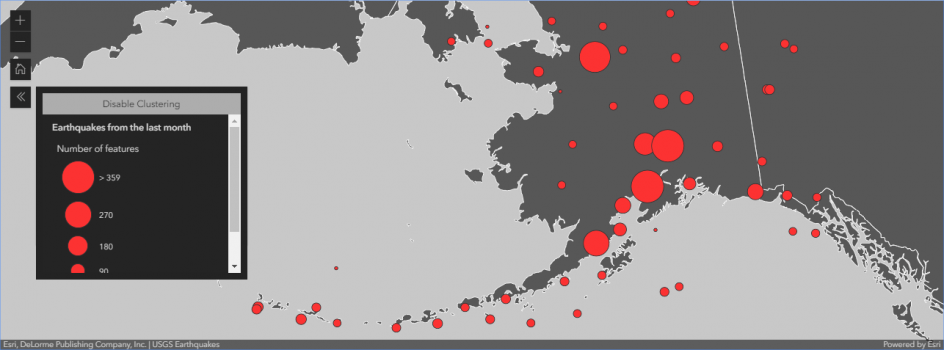
4.x now supports client-side point clustering of feature layers, GeoJSON layers, and CSV layers in 2D map views. You get to decide what each cluster should communicate about the underlying data. You have the option to use a single cluster symbol to be sized based on the number of features within the cluster, or style it in a way that signifies a summary of the features’ values within the cluster: Either represent the average or predominant values of the features within each cluster, or the most common value within a cluster. Popups can also be configured to show summary information for the cluster.
There are some exciting aspects of clustering that surpass what is possible in 3.x, simply because it builds upon capabilities already part of 4.x. For example:
- Cluster more data: 4.x allows you to load and render very large datasets with optimized performance, thanks to WebGL and the smarts behind the feature layer. Clustering piggybacks on this capability. While 3.x had a limitation of clustering a maximum of 50,000 features, 4.x doesn’t have such a limit. You can cluster all data that can be loaded into your app.
- Fun with client-side filters: When you perform client-side filtering on the features in a layer, clusters are automatically recomputed client-side. The updated clusters only display information complying with the filter including the number of features and the predominant category of the renderer. Check out this sample that demonstrates how clustering works when you dynamically filter data in a layer.

- GeoJSON layers: The GeoJSON layer is a first-class citizen in the 4.x API; so just as you can style it, perform client-side queries, filter, and calculate statistics, etc – you can now enable clustering in the same way that you would with a feature layer.
As with 3.x, clustering options can be defined directly in your code or configured it in a web map in ArcGIS Online or Enterprise, and then simply loaded it in your app. This is just the initial release of clustering; work is already underway for expanding the flexibility and power of clustering including server-side clustering for huge datasets and the ability to label clusters with the count of underlying features. Stay tuned for upcoming releases and please share your feedback with us via the /next GitHub repo.
Save web maps
Have you ever wanted to allow your end users to add a layer to a web map, save a new initial extent, update what layers are visible, or even create a new web map, right from your own app? Saving web maps is now possible with a few lines of code. You can either update an existing web map or create a new one and save it in ArcGIS Online or ArcGIS Enterprise. This is a very simple but powerful capability that will enable you to build new workflows into your applications.
map.saveAs({
  title: "My new WebMap",
  portal: portal
});
Easily compare data with different time extents
We have made a few enhancements to the APIs capabilities when it comes to visualizing temporal data. One of the updates is the ability to set a time “offset” on a feature layer. This allows users to overlay and compare features from two or more time-aware layers with different time extents. For example, you might want to visualize datasets from 1919 and 2019 concurrently to compare and understand how a phenomenon has changed in 100 years. To do this, you could set the offset of the 1919 feature layer to a value of 100 to temporarily shift the data to 2019. Then using the TimeSlider widget, interactively adjust the time extent to compare the data from both years, month to month (or any other desired time extent).
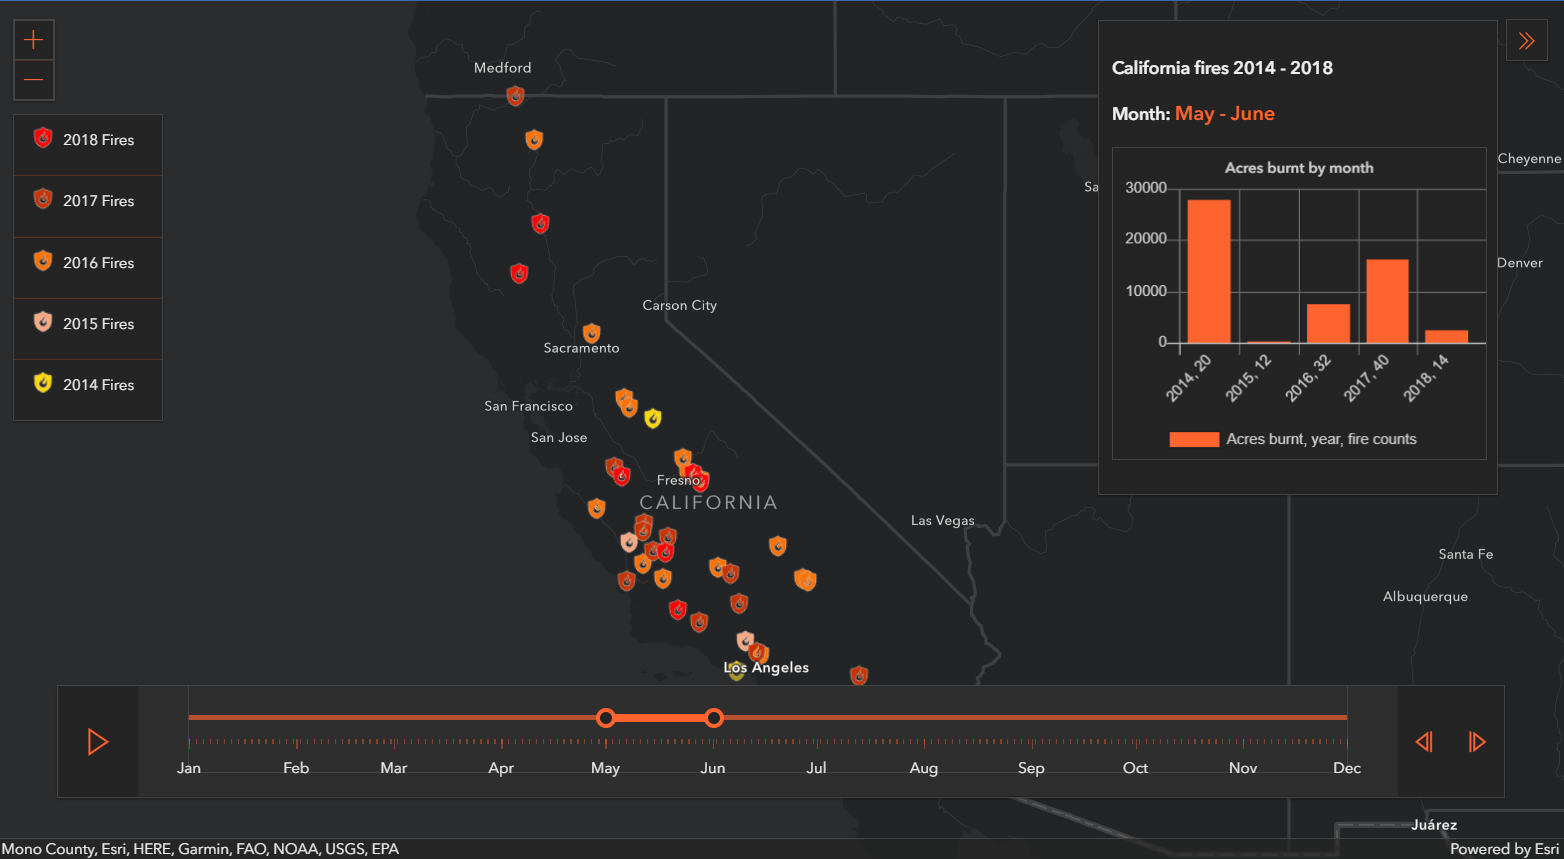
This sample visualizes 5 years of fires in California using the offset property and the TimeSlider widget.
Edit attachments & new options
Editing support has been introduced in the 4.x API iteratively over multiple releases. With version 4.14, you can now add, update, and delete attachments with the FeatureLayer.applyEdits() method. In the future, this capability will also be available via the API’s editing widgets. More options were also added to applyEdits in order to control how edits should be handled in various scenarios; for example to specify the geodatabase version to apply the edits (for versioned databases) and whether edits should be applied only if all submitted edits succeed.
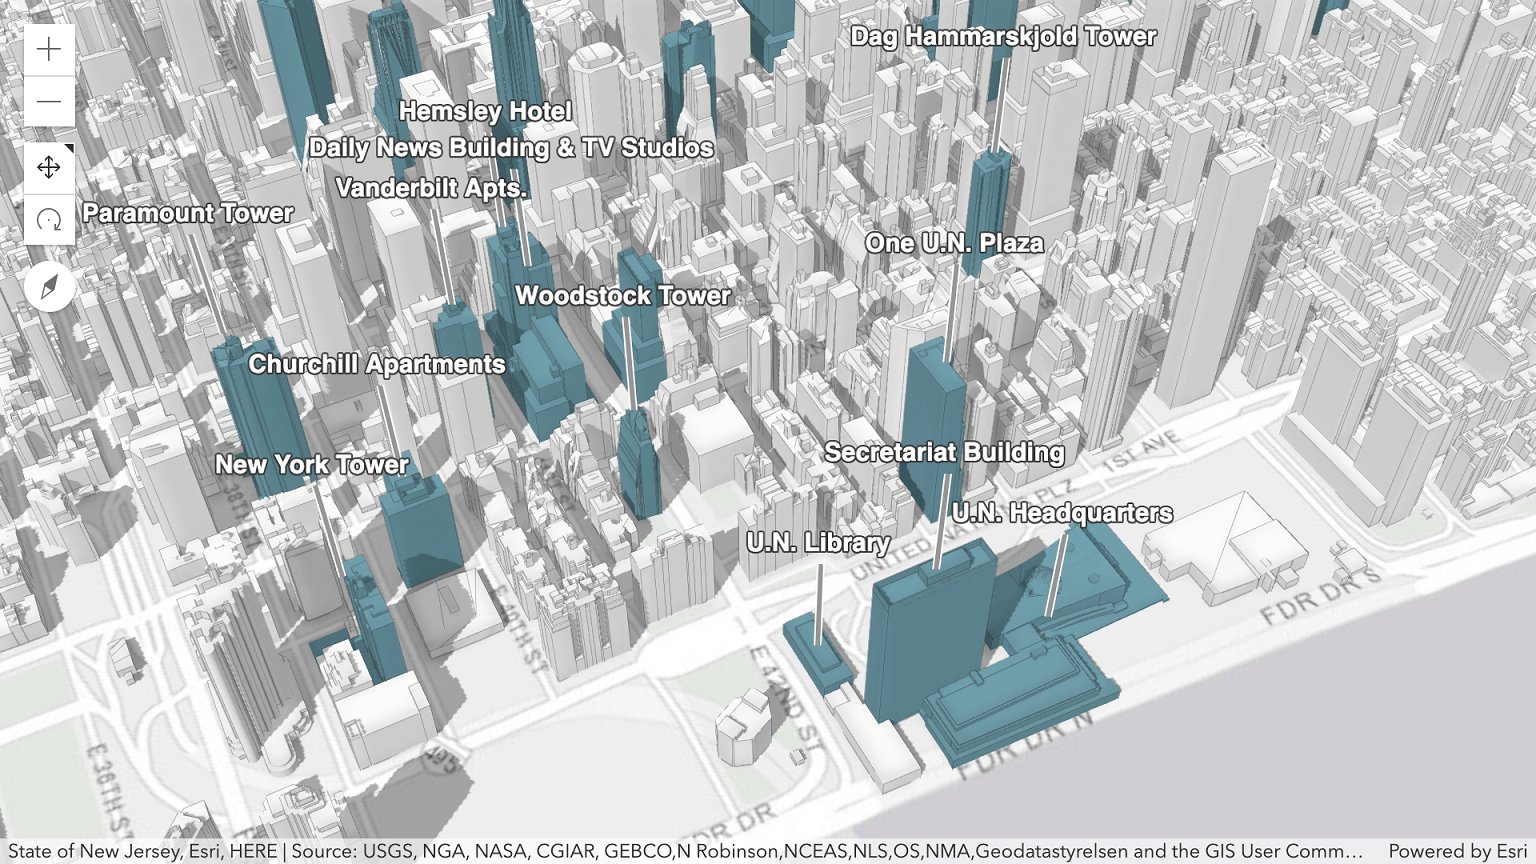
Line of sight widget
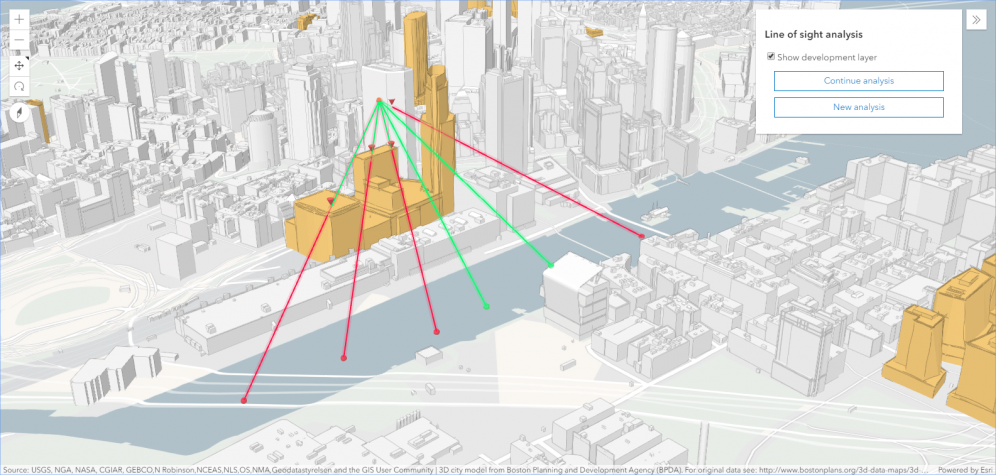
The new Line of Sight widget allows you to analyze visibility in your scene. Place two or more points on buildings, ground and other scene objects to evaluate direct line visibility. For example, you might want to evaluate the impact of planed construction on the surrounding buildings. Analysis results update interactively as you move the observer or targets within your scene. In addition to allowing the end user to interactively perform the analysis, you can programmatically set the observer and targets for a line of sight analysis to visualize whether the view between existing features in your scene is obstructed or not.
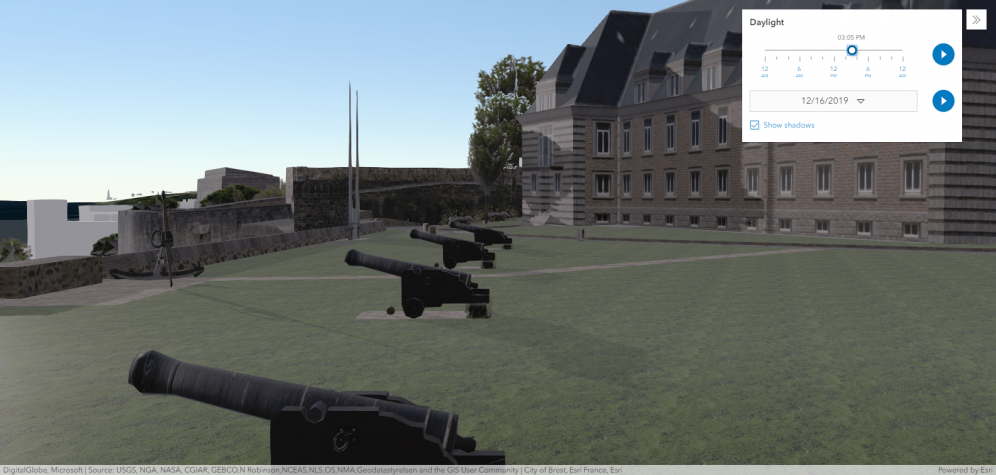
Daylight widget
Simulate shadow and ambient lighting conditions using the new Daylight widget. Change the time and date to see the shadows casted by 3D objects in your scene. The widget also allows you to animate the sunlight throughout the day, and even includes stars in the sky in their correct placement. This widget is powered using accurate lighting information for any day, time, and place on earth.
Labels for 3D Object Scene Layers
SceneLayers that show 3D objects such as buildings now support labels, offering the same labeling capabilities as feature layers. This will simplify your code when labeling 3D objects as you can generate labels directly from the attributes of the SceneLayer cache as opposed to using an additional feature layer for labeling.
Performance improvements
We are continually evolving the API to increase performance (more can be found in the release notes):
- Significantly improved GPU performance by reducing the number of polygon vertices drawn, meanwhile maintaining the same visual quality of the polygon shape.
- When rendering vector tiles, we generate 20-25% fewer WebGL calls and much fewer JavaScript calls, which results in a smoother interaction experience.
- Optimized rendering of integrated 3D mesh.
- Client-side geometry optimization: Rendering of graphics is faster when they are added to graphics and GraphicsLayer, or feature collections added to the FeatureLayer.source because the API no longer simplifies geometries. It is the developer’s responsibility to check the correctness of polygon geometries before they are added to those layers (you can use geometryEngine.simplify() to make sure that polygons display correctly on the client).
API Modernization
With each release, we advance the API in terms of modernization. As modern browsers offer an increasing amount of capabilities, we are able to do more with less JavaScript code that is part the API. This results in a more powerful and lean API. In 4.14, we focused on the following areas:
- Moving towards native promises: Promises play an important role in the API as they allow for writing cleaner code when working with asynchronous operations. Previously, promises were implemented using the Dojo Promise. In version 4.12, we introduced the option to enable native JavaScript promises. We are planning to make the API return native Promise by default at 4.15, then completely remove Dojo promise at 4.16. More details about this functionality will be available in an upcoming blog post.
- Eventual removal of Dojo’s declare module: We are working on removing the dependency on Dojo’s declare module (and eventual removal of the APIs dependency on Dojo altogether). This work entails migrating the API class implementation to leverage the pure JavaScript (and TypeScript) class system only as opposed to using dojo declare. The first step of this migration is to adopt the mixin pattern with TypeScript and JavaScript as opposed to multiple inheritance. While multiple inheritance is still supported in apps built with the API, it was deprecated as of version 4.13 and will eventually require you to make changes to your code (if you are using this pattern). A warning message will display in the browser console to help remind you about this change.
New guide page on color selection best practices
All the color ramps used in the Smart Mapping symbology APIs can now be easily viewed, filtered, and copied to your apps in a guide page: Esri Color Ramps. This guide, together with the new Visualization best practices guide, provides easy access to more than 300 color ramps designed by color experts. They are categorized to help you make smart decisions when choosing colors for renderers and charts, and can be used independently of Smart Mapping.
Learn more
There is a lot more to this release, for example an option to disable mouse-wheel zooming and single finger panning (useful for touch devices), updates to Smart Mapping including the ability to control symbol sizes by scale, and more than 50 bug fixes. To learn more about the release, explore:
Another great way to learn about the recent advances in the JavaScript API and the broader ArcGIS platform is by attending the Esri Developer Summit taking place in March 2020 in Palm Springs, CA. The event features a wide range of technical sessions presented by the ArcGIS API for JavaScript Development team, a showcase where you can talk to the team about your project and any questions you have, social events, and much more. Stay tuned for an upcoming blog that will serve as a guide for web developers.


Commenting is not enabled for this article.