Despite the conventional wisdom that urges “less is more,” with the latest release of the ArcGIS API for JavaScript, more is more. With faster feature layers, optimized querying via vector feature tiles, and a growing collection of client-side processing capabilities that enable rapid interaction and analysis, the ArcGIS API 4.8 for JavaScript removes performance barriers for developers.
WebGL-Powered Feature Layers
For years, browser limitations meant that developers had to be careful about how much data was brought into the browser for use in interactive visualizations. Processing was performed almost entirely on the server side, limiting the kinds of workflows that could be accomplished in web apps while still providing a good user experience.
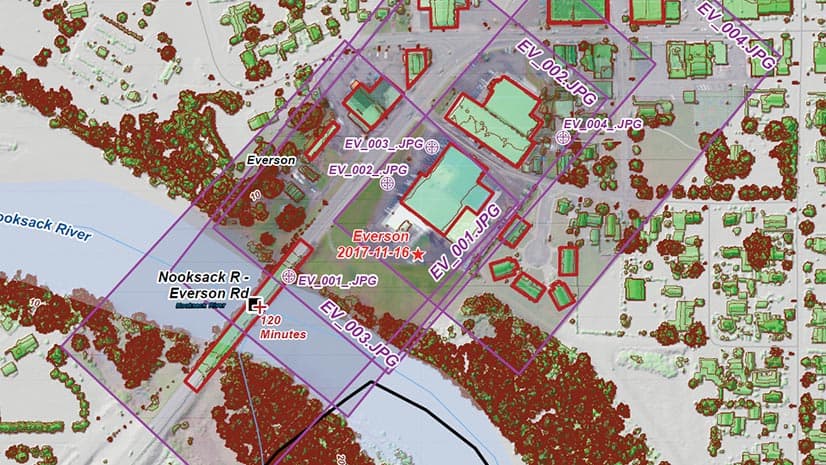
Typically, a web app consists of a basemap and one or more feature layers that contain data that is downloaded to the client and used for interaction and analysis. In September 2017, the ArcGIS API for JavaScript’s feature layer was enhanced to take advantage of WebGL. This enabled hardware-accelerated rendering of the graphics using the graphics processing unit (GPU) instead of the browser.
This has resulted in the far more rapid display of both small and large datasets. The number of features that can be displayed in 2D and 3D feature layers—while still maintaining a high level of performance—went from tens of thousands of features to hundreds of thousands of features.
The ability to have access to large datasets on the client opened up new possibilities. Datasets that had previously been treated more like basemaps with only limited interaction can now be more effectively used as operational layers. For example, end users can explore large datasets completely on the client side by dynamically changing the visualization of layers to focus on the aspect of the data they are interested in or filter the data by attribute.
More Efficient Querying
Although WebGL enables large datasets to be rendered on the client, that doesn’t address the challenge of optimizing the transfer of large datasets from the server. Vector feature tiles now make that possible and practical.
Feature layers published to ArcGIS Online now access the data via vector feature tiles. Vector feature tiles have many of the benefits of traditional vector tiles: requests are split into consistent, smaller spatial queries and server-side and client-side caching is enabled for quick response times. Queries are also performed using the Protocolbuffer Binary Format (PBF), which reduces the size of the data delivered to the browser. Feature layers powered by ArcGIS Enterprise feature services will be rendered using WebGL at 10.6.1. Full server-side caching and PBF will be in an upcoming release.
Vector feature tiles, unlike vector tiles, construct continuous layers containing the feature geometries and attributes that can be mapped and analyzed on the client without worrying about tile boundaries. Also, vector feature tiles are not “precooked.” They are directly linked to their data source: as the data changes, features are updated.
Moving More Processing to the Client
Once features are on the client, it makes sense to do as much processing as possible on the client rather than waiting for round trips to a server to perform tasks. Client processing using this approach feels almost instantaneous and allows for dynamic workflows.
Built upon some of the latest advances in web technology, the client-side capabilities of the ArcGIS API for JavaScript have been incrementally growing with each release. A few of these capabilities are the ability to query features in the layer, access the full geometry engine, and use client-side projection.
Developers can perform queries and calculate statistics using the data currently available for drawing. The API uses web workers to execute the query on a separate thread from the display. To perform queries, the API maintains an in-memory database and spatial index of all features, along with a SQL engine that is used to evaluate WHERE clause expressions.
Geometric operations, such as buffering and calculating spatial relationships, can be performed in a variety of scenarios including real-time validation while drawing.
The projection engine, used by ArcGIS Pro and the ArcGIS Runtime SDKs, was packaged as a WebAssembly (WASM), included with the API, and enables fast client-side projection for feature layers and CSV layers.
API tools and widgets already part of the API and those that will be available in upcoming releases take advantage of these client-side capabilities to provide an interactive user experience.
Seeing the Power of Client-Side Processing
This web app, showcased during the 2018 Esri Developer Summit demonstrates the client-side processing capabilities of the ArcGIS API for JavaScript. It is based on an Esri Story Maps app called Eyes of the Hurricanes that was featured on the Maps We Love website. This app visualizes hurricane data obtained from the National Oceanic and Atmospheric Administration (NOAA) National Centers for Environmental Information. More than 130,000 features are added by simply dropping the CSV file on the app’s map. For each hurricane, the CSV file contains each hurricane track location in latitude-longitude, its maximum wind speed, and its Saffir-Simpson hurricane category.
Instead of using the World Geodetic System (WGS) 1984, the standard coordinate system used by GPS, the data is reprojected into the South Pole Stereographic coordinate system. This not only matches the basemap but also showcases the circuitous path of hurricanes. The reprojected data is visualized with a unique value renderer using firefly image symbology based on the hurricane category on the firefly basemap, which is available from the ArcGIS Living Atlas of the World.

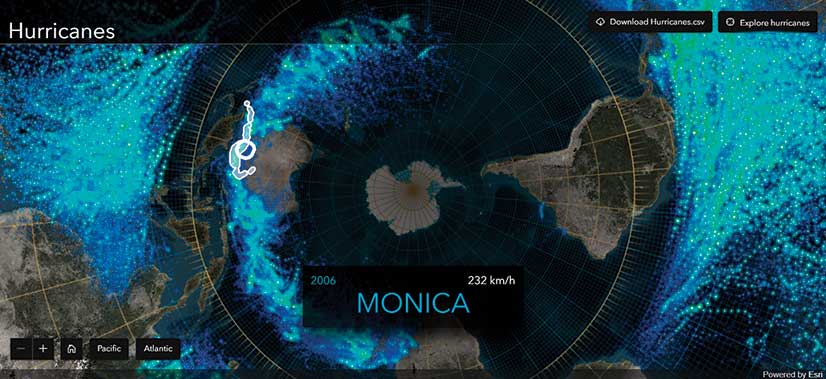
When rotating the view from the South Pole to the North Pole, the animation is smooth. Individual hurricane tracts can be interrogated interactively on the client at the cursor’s location to see the hurricane’s track, the year it occurred, and its maximum wind speed. As the user moves the cursor, a spatial query is performed to identify the hurricane within the search area that has the maximum wind speed. To highlight the hurricane track, the dataset is queried to find all the points that are part of the path.

The 4.8 release of the ArcGIS API for JavaScript includes additional enhancements to labeling, drawing improvements, the ability to create heat maps, enhancements to underground navigation, and many other capabilities. Read the release notes on the ArcGIS for Developers site.
About the author