One of the common mapping tasks in groundwater projects is creating water level maps. In many cases, a set of maps is created to show the changes in water levels over time. Using the ArcHydro Groundwater (AHGW) tools it’s easy to automate the process of creating water level maps in ArcGIS. Last year, at the American Water Resources Association (AWRA) Spring Specialty Conference we (Aquaveo) showed a demo of creating and animating water level maps using a test case of the Edwards Aquifer in Central Texas. We got a number of inquiries from users about this process and how they can implement it with their data. So, in this post we will cover the main steps in a workflow for creating water level maps and animating them.
Download this animation created for the AWRA 2010 Spring Specialty Conference.
Here are the steps we followed to create the animation:
Step 1 – Summarize water levels
Water level measurements taken at wells were summarized over a given time period (for example, to calculate the average water level for a given month). The summary values are related to a map location (usually by adding the X and Y coordinates of a well) to create a new set of points holding the summarized time series.
To automate this process, we used the Make Time Series Statistics tool available as part of the AHGW tools. The tool inputs include a set of well features and related water level measurements stored in a table. The output from this tool is a set of point features with an attribute representing the calculated statistic (e.g. average water level).
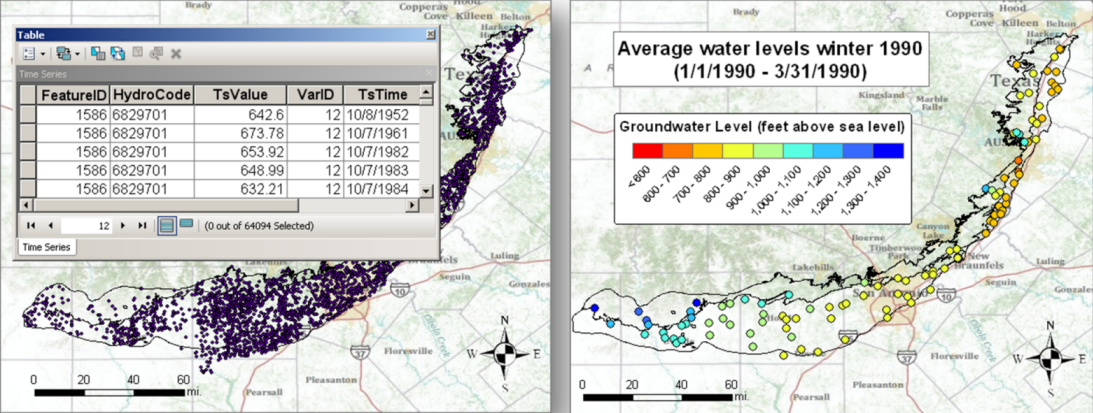
On the left, a set of wells and related water level measurements. On the right, averaged water levels for the winter 1990 period. The average values were derived using the Make Time Series Statistics tool available as part of the AHGW tools.
Step 2 – Interpolate to create water level surfaces
In this example we used the Inverse Distance Weighted (IDW) tool in the Spatial Analyst toolbox, but you will need to define the interpolation method for your project. We also loaded the created raster into a Raster Catalog so it can be indexed with the time stamp (this enables us later to easily animate the rasters in sync with other datasets). To automate the process of loading and indexing the rasters into a Raster Catalog we used the Add to Raster Series tool, available as part of the AHGW tools.
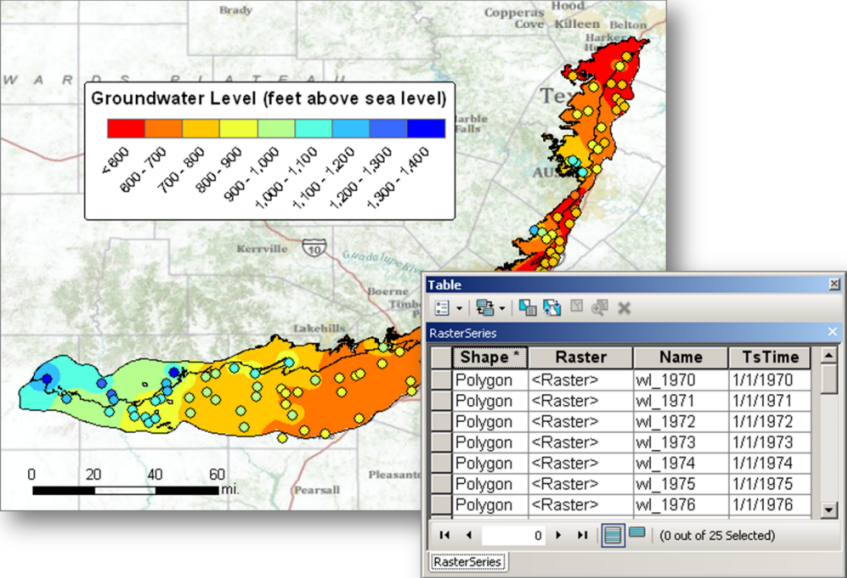
Water level rasters are created by interpolating the summary statistics created in Step 1. The rasters created are loaded into a Raster Catalog and indexed with the appropriate time stamp using the Add to Raster Series tool.
Step 3 – Derive Contours
We used the Create Contour tool (available in Spatial Analyst and 3D Analyst) to create contour lines for each of the rasters created.
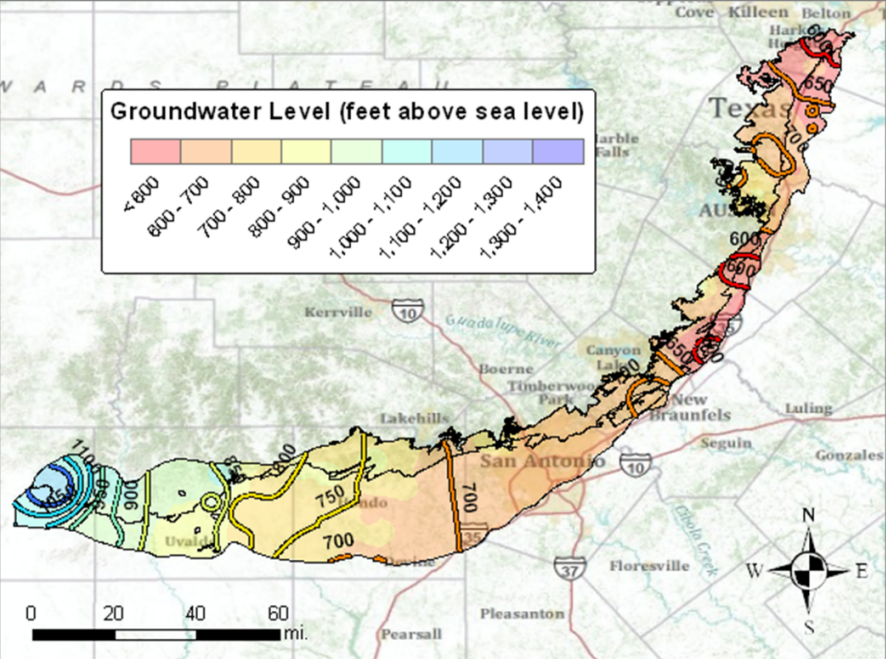
Water level contours derived from the rasters using the Create Contour tool.
Step 4 – Create a single feature class for water level points and contours
In order to animate all the datasets (points, rasters, and contours) it is easier to create a single feature class for each data type. This was a two step process:
- Add a TsTime field to the points and contour feature classes and populate this field with the appropriate date for the feature class. For example, points and contours representing the winter of 1990 were given a TsTime = 1/1/1990. You can batch process the Add Field and Calculate Field tools to streamline this task.
- Use the Append tool to upload points and contours into one feature class (one for contours and one for points).
Step 5 – Animate
Once we have all the datasets prepared, it is easy to animate the maps. We used the Animation toolbar, so we are able to animate two data frames at once (notice the animated cross section is in a second data frame). if you are
only animating one data frame you can use the Time Slider Window available in ArcGIS 10. Here are the main steps in setting up the animation:
- Go to each layer you want to animate (points, contours, raster catalog) and enable time for that layer. Set the appropriate Time Field and the Time Stamp Interval.
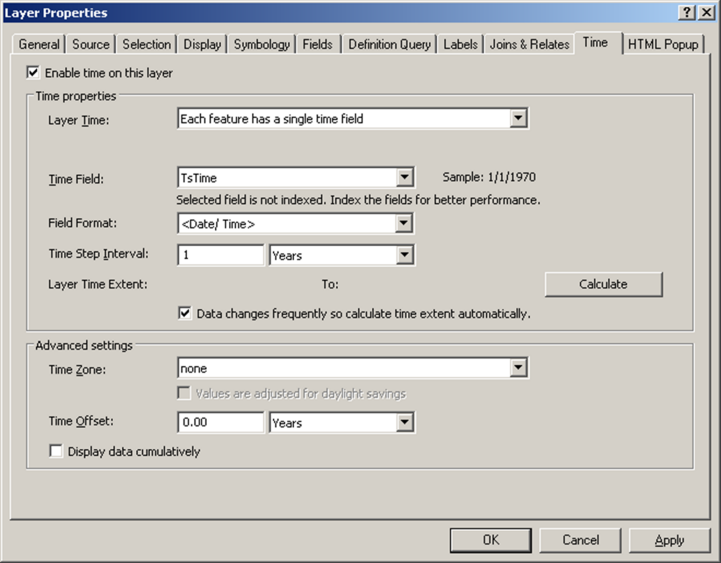
Setting the layer properties to enable time.
- In the Animation toolbar, select Animation > Create Time Animation. This will create a new Time Animation Track. You should get a message that confirms that a new track was created.
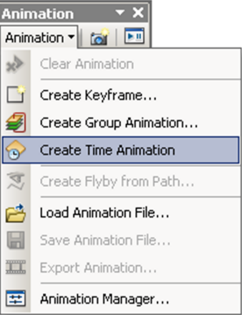
Creating a new Time Animation track.
-
If you now open the Animation Manager you should see that a new Time Animation Track has been created. Also, if you look at the Keyframes tab you should see the extent of the animation.
- Repeat steps 1 and 2 for any other data frame you want to animate. In our example we have a cross section on which we animate water level changes along the cross section.
At the end of this process we have two animation tracks, one for each data frame, which can be animated simultaneously. You can open the Time View tab to see the tracks and use the slider within the time view to animate the map.
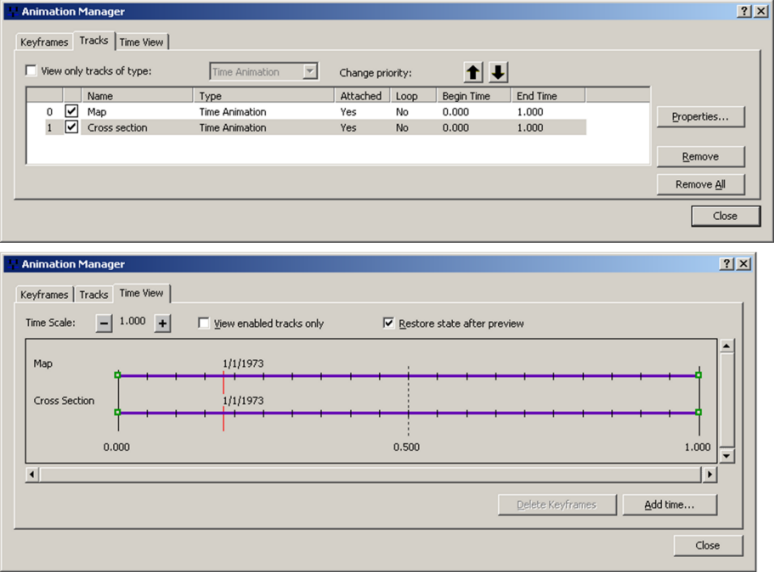
Multiple animation tracks viewed in the Animation Manager.
You can now use the animation controls to show the change in water levels over time.
Automation
Using Model Builder it is easy to automate the process presented in Steps 1-3. We put together a model that runs the Make Time Series Statistics, IDW, Create Contour, and Add to Raster Series tools in one step. This will enable you to quickly process your data and also document your workflow. While constructing the model you might consider defining Environment Settings such as the Extent and Mask for the raster analysis.
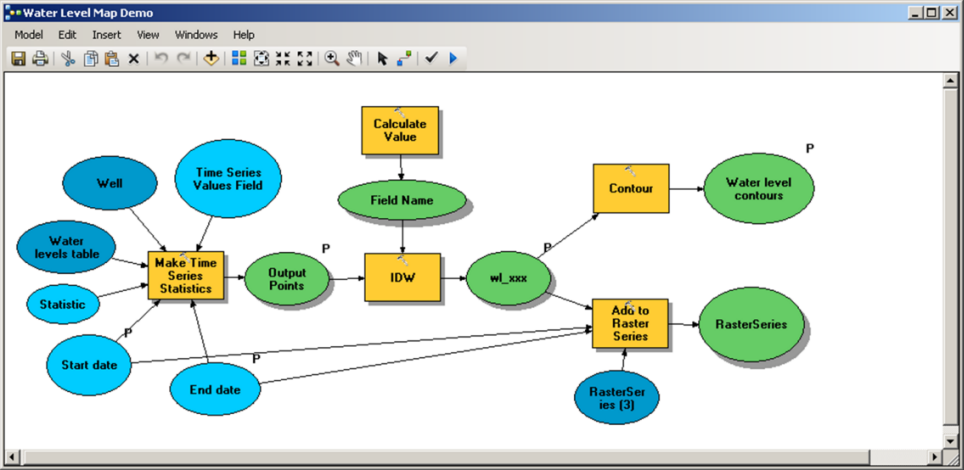
Model to automate the creation of water level maps.
The animation shown includes a cross section data frame with lines representing the water levels along the cross section. In our next post (Part 2) we will show how the cross section was created and water level lines added to it.
For more information on Arc Hydro Groundwater, visit the Hydro Resource Center Groundwater page, Education gallery, or
![]()
Special thanks to Gil Strassburg and Tim Whiteaker for providing this post. For more information contact Gil (gstrassberg@aquaveo.com) or Tim Whiteaker (twhit@mail.utexas.edu).

Article Discussion: