Introduction
A methodology based on a combination of “RDBMS (Relational Database Management System) – ArcGIS – Arc Hydro Groundwater (AHGW)” technologies is illustrated using data from an on-going project aimed at developing an inventory of the groundwater resources of the Saguenay-Lac-Saint-Jean region, Quebec (Canada).
The implementation of a spatial database has been mandated by the Quebec Ministry of Sustainable Development and Parks (MDDEP) for the Saguenay-Lac-Saint-Jean region (SLSJ) of the province of Quebec in Canada. This provincial project, known as PACES (“Programme d’Acquisition des Connaissances sur les Eaux Souterraines”), is being conducted in partnership with the regional municipal counties (MRC), the MDDEP, the City of Saguenay and the “Université du Québec à Chicoutimi (UQAC)”. The spatial database is intended to provide a regional picture of groundwater resources in terms of both their quantity and quality. This work involves the compilation of existing hydrogeological data as well as the collection of new data to complete existing information gaps. The final objective of the database implementation consists of characterizing regional aquifers and understanding associated groundwater flow systems. This provincial-scale project should improve our knowledge of regional hydrogeology and provide decision-makers with additional information for the sustainable management of groundwater resources. In order to illustrate the methodology of 3D hydrostructural subsurface modeling with AHGW, Chesnaux et al. (2011), selected a 225 km2 region centered on the municipality of Shipshaw in the SLSJ region. The Shipshaw area was selected for its large number (261) of boreholes available in the region.
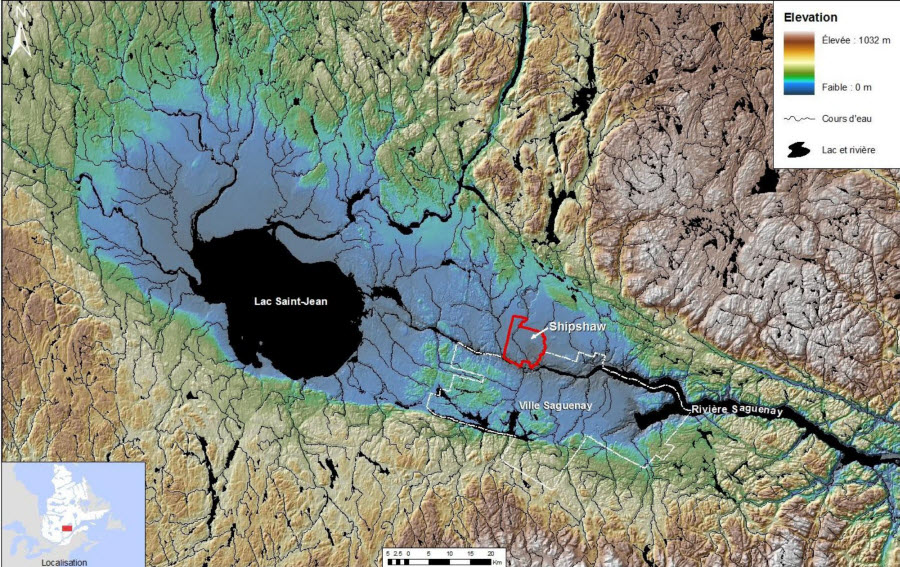
Location and digital elevation model (DEM) of the Saguenay-Lac-St-Jean region of Quebec and location of the Shipshaw study area (after Chesnaux et al., 2011).
The AHGW Geodatabase
An AHGW database has been created using the Arc Hydro Groundwater data model template, which was customized for the project. The main table is called Wells and corresponds to the Borehole central table of the geodatabase, which actually locates the wells. This table is associated with the BoreholeLog table which corresponds to the stratigraphy table of the geodatabase. The other relevant table of the AHGW database is entitled HydrogeologicUnit and lists the geological nature of the subsurface materials, their identifier, their definition and their code. This table corresponds to the facies code of the stratigraphy table of the geodatabase. Other tables of AHGW are output tables derived from the AHGW geomodeling results (BoreLine, SectionLine, BorePoint, GeoSection, GeoRaster and GeoVolume).
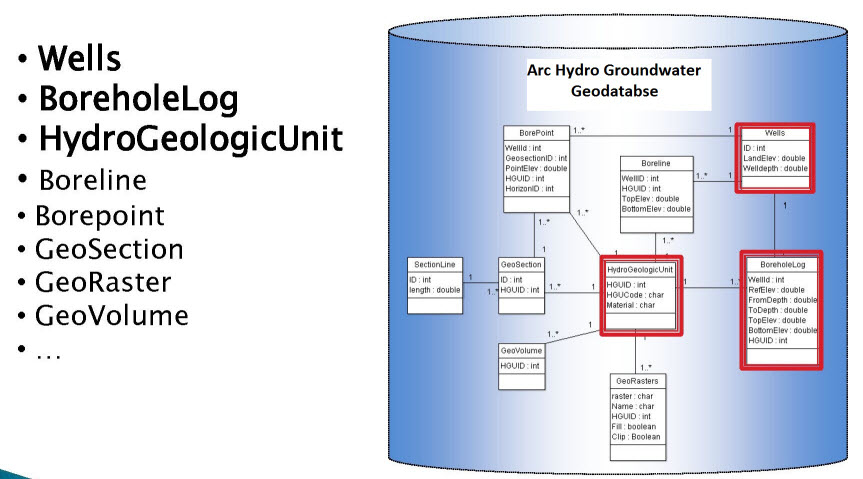
AHGW geodatabase structure used for the project.
Application of Tools to Create Maps/Cross Sections/3D Subsurface Models
The development of a 3D subsurface model included four main steps: borehole classification, creation of 2D cross sections, creation of 3D GeoSections from the 2D cross sections, and the creation of a 3D model including GeoRasters and GeoVolumes.
Borehole classification
The borehole editor tool available in the AHGW toolset allows for visualization of a borehole stratigraphy. Each hydrogeological unit encountered within the borehole is assigned a unique hydrogeologic unit identifier (HGUID) observed between a top and bottom elevation of the unit intercepted by the borehole. An original aspect of using AHGW is the concept of BoreLines. Indeed, the borehole data are stored linearly instead of punctually. Each 3D well feature is divided into segments (borelines); to each segment an HGUID identifier is assigned in order to identify the geological unit. BoreLines are created from the BoreholeLog table that presents borehole stratigraphy observed within each borehole.
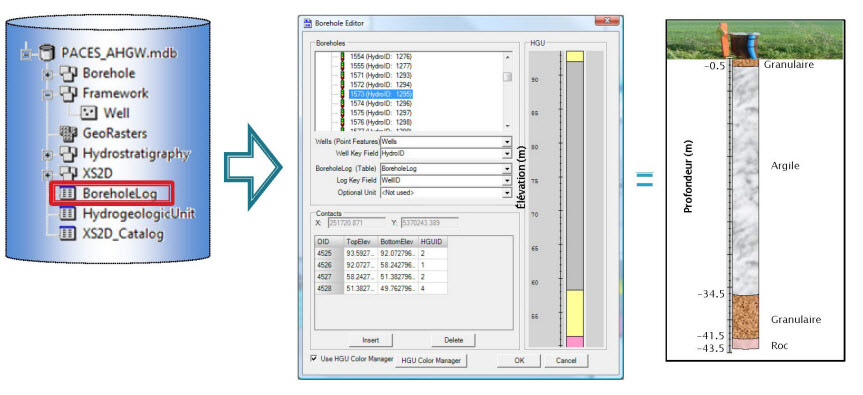
Editing and visualizing stratigraphy of boreholes using the AHGW borehole editor.
Creation of 2D Cross Sections
An appealing aspect of AHGW is the development of cross sections extracted from the borehole information. A variety of tools included in AHGW allow for building cross sections in ArcMap. The construction of cross sections begins when the user draws a line on the map corresponding to the trace of the required cross section. Then, through the application of a buffer the user can select in the vicinity of the line the particular boreholes needed to be considered for developing the cross section. AHGW creates finally a panel on which the BoreLines corresponding to the selected boreholes are projected. Additional information such as a DEM and outcrops may also be added to the cross section. Using editing tools, the user may create cross section panels by manually interpolating the different geological layers identified in BoreLines.
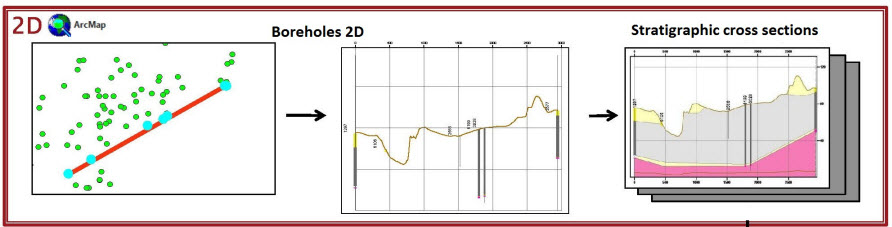
Steps to create 2D cross sections. From left to right: sketching a section line, adding borehole and outcrop information to the cross section data frame, and sketching cross section panels.
Creation of 3D GeoSections from 2D Cross Sections
A cross section is a 2D representation; however with AHGW it is possible to transform several cross sections into 3D features (GeoSections) that can be viewed in ArcScene. A set of GeoSections can form a fence diagram. From the fence diagram we can assign a HorizonID (numbering system for layers) to each geological unit in each Geosection, an essential step for creating a Geovolumes (see next step).
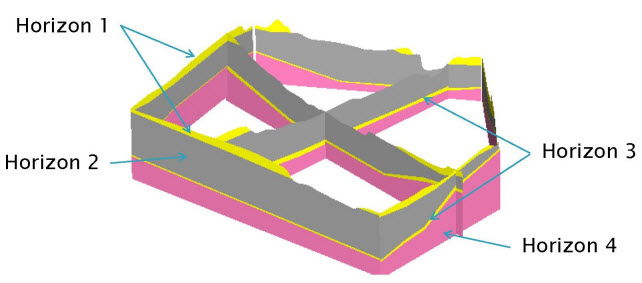
3D GeoSections created by transforming 2D cross section panels to 3D features.
Creating a 3D Model Including GeoRasters and GeoVolumes
A GeoVolume is a 3D feature for representing volumes within the subsurface. In order to create GeoVolumes, GeoRasters must first be created. A GeoRaster corresponds to the top surface of each identified geological layer; it is a raster surface for representing the top and bottom of hydrogeologic units. GeoRasters are created by interpolating points (BorePoints) derived from borehole stratigraphy and additional points sampled along GeoSection features. These points are created along a GeoSection at the top and bottom elevations of each layer and
characterize the geological unit with the HorizonID. In this example, Inverse Distance Weight (IDW) was applied to interpolate between the BorePoints and create a set of GeoRasters. This approach yielded the best results for our study area. Note that other interpolation options are also available within ArcGIS and may be evaluated independently based on the resulting outcomes. The GeoRasters are linked to a RasterCatalog which is used for storing, indexing and attributing the interpolated rasters. The RasterCatalog associates the identifier of a raster and the identifier of the geological unit. Using the AHGW tools one can automatically create GeoVolumes from GeoRasters.
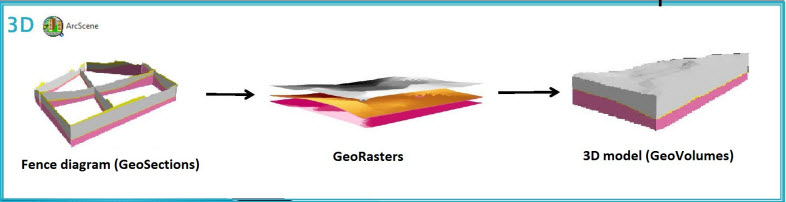
Steps for creating a 3D subsurface model. From right to left: A set of GeoSections forms a fence diagram (these were created by transforming the 2D cross sections to 3D), GeoRasters are interpolated from the bore data and the additional points sampled along the cross sections, and GeoVolumes are created from the GeoRasters.
Discussion
A procedure using AHGW for the development of a hydrogeological model has been applied to identify aquifers and reconstruct their boundaries based on the geodatabase and 3D models. The construction of 3D models should help to better predict the extension and thickness of groundwater reservoirs, i.e. groundwater resources availability. Note that the accuracy of the 3D models depends on the amount, the nature and the quality of the information extracted from the geodatabase for incorporation into these models. A greater amount of available data permits more reliable predictions of groundwater resources and greater confidence for the modeler.
A possible application of the 3D subsurface models developed using the AHGW tools is the creation of input data for groundwater flow and transport codes. For example, the 3D hydrostructural models obtained with ArcGIS/AHGW could be exported to a groundwater flow and transport code in order to simulate and predict groundwater flow and groundwater contaminant propagation in the subsurface. However, this application requires further tool development as it is not currently available as an existing AHGW tool.
Acknowledgements
This project is funded by the Programme d’acquisition de connaissances sur les eaux souterraines du Québec (PACES), with contribution by the Ministère du Développement durable, de l’Environnement et des Parcs, UQAC, Conférence régionale des élus du SLSJ, Ville de Saguenay and the four Municipalités régionales de comté of the SLSJ region. Funding from the Fonds québécois de recherche sur la nature et les technologies (FQRNT) and the Fondation de l’UQAC (FUQAC) are also acknowledged.
For more information on the project contact Dr. Romain Chesnaux
(Romain_Chesnaux@uqac.ca).
For more information on the Arc Hydro
Groundwater tools visit the Aquaveo website.
Reference
Chesnaux, R., Lambert, M., Fillastre, U., Walter, J., Hay, M, Rouleau, A., Daigneault, R., Germaneau, D., Moisan, A. 2011. Building a geodatabase for mapping hydrogeological features and 3D modeling of groundwater systems: Application to the Saguenay-Lac-St-Jean Region, Canada, Computers & Geosciences, DOI: 10.1016/j.cageo.2011.04.013.
Special thanks to Dr. Romain Chesnaux for providing this post. Questions for Romain: Romain_Chesnaux@uqac.ca

Article Discussion: