The Routing and directions location service is now available in the R-ArcGIS Bridge via the {arcgisrouting} package!
Routing and directions is one of a handful of Mapping and location services.
With this, the R-ArcGIS Bridge is baby stepping its way to full support of all services Esri provides.
- Place finding is powered by the {arcgisplaces}
- Geocoding is supported via {arcgisgeocode}
- Routing and directions is now supported via {arcgisrouting}
With this, only Mapping, Data visualization, Data Enrichment, and Elevation, are left!
Routing and Directions from R
The Routing and directions location service enables developers to plan routes, create directions, and perform “advanced analyses” on street networks. {arcgisrouting} makes it possible to:
- Create a set of directions along a route: find_routes()
- Calculate drive / travel times and create “isochrones”: find_services_areas()
- Route fleets of vehicles: route_vehicles()
- Snap GPS points to roads: snap_to_roads()
- Solve location-allocation problems: location_allocation_job()
The package has full coverage of all endpoints provided by the service supporting small direct requests, as well as asynchronous and large ones.
Worked example
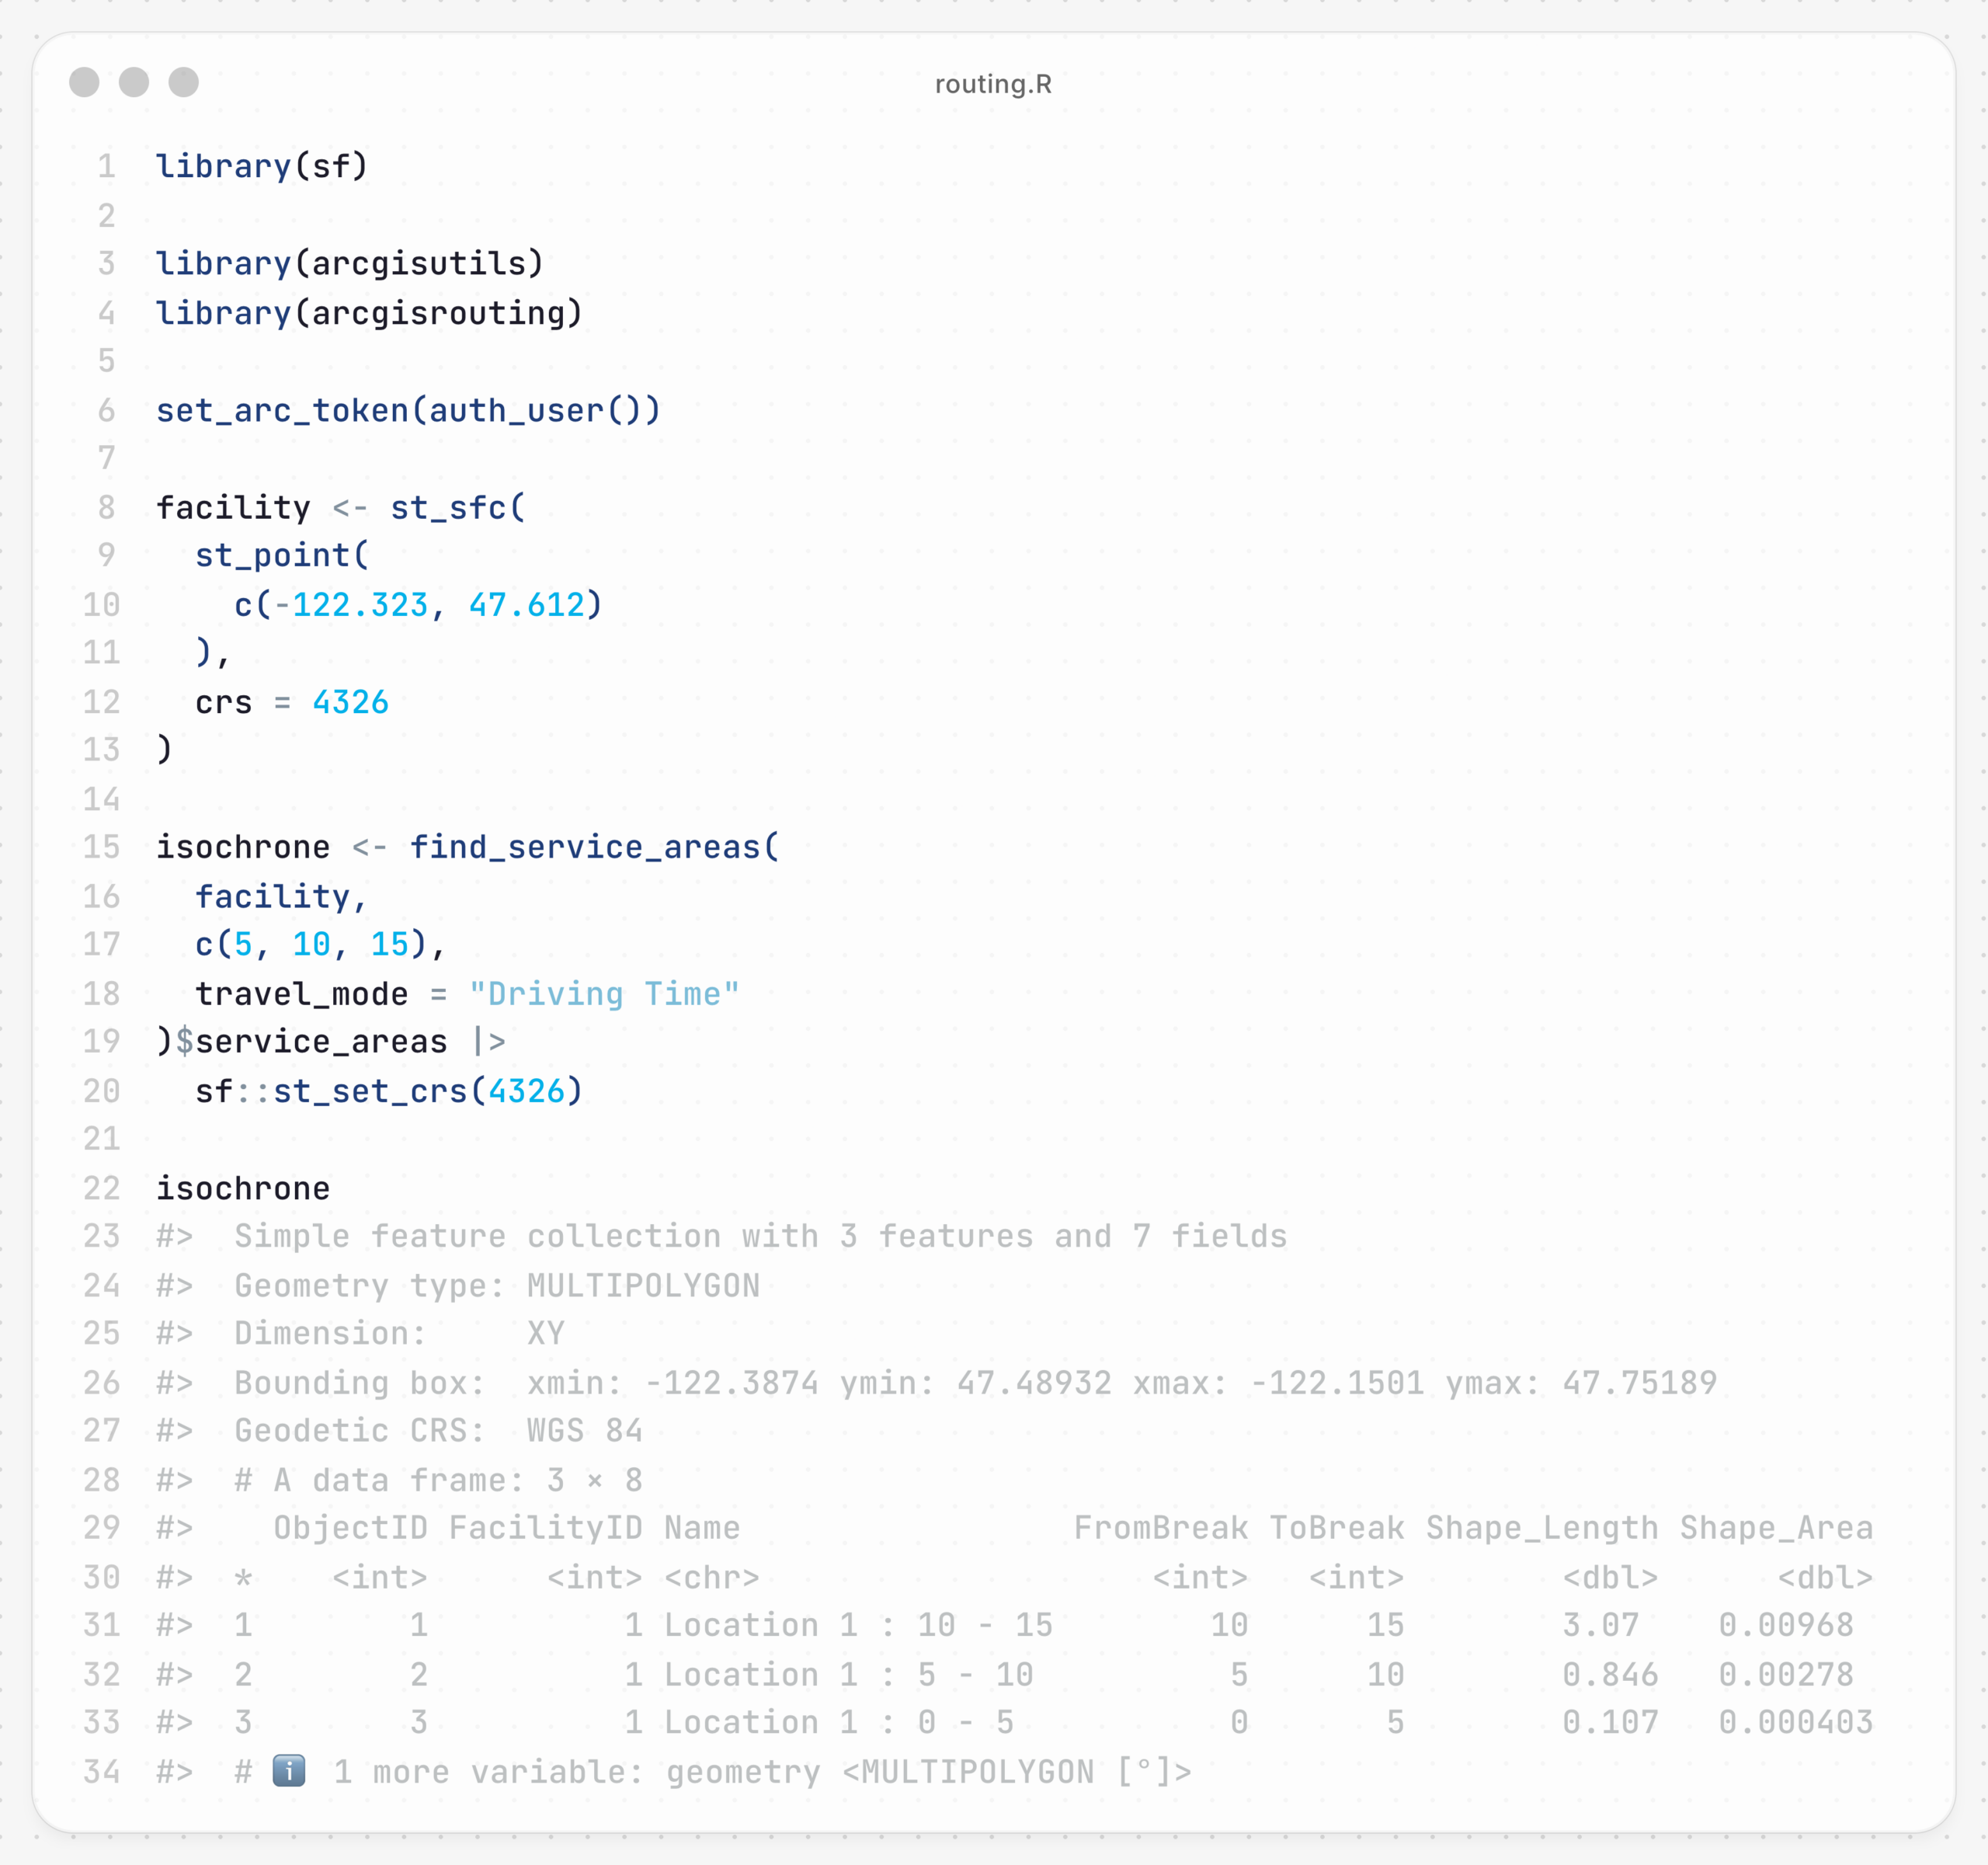
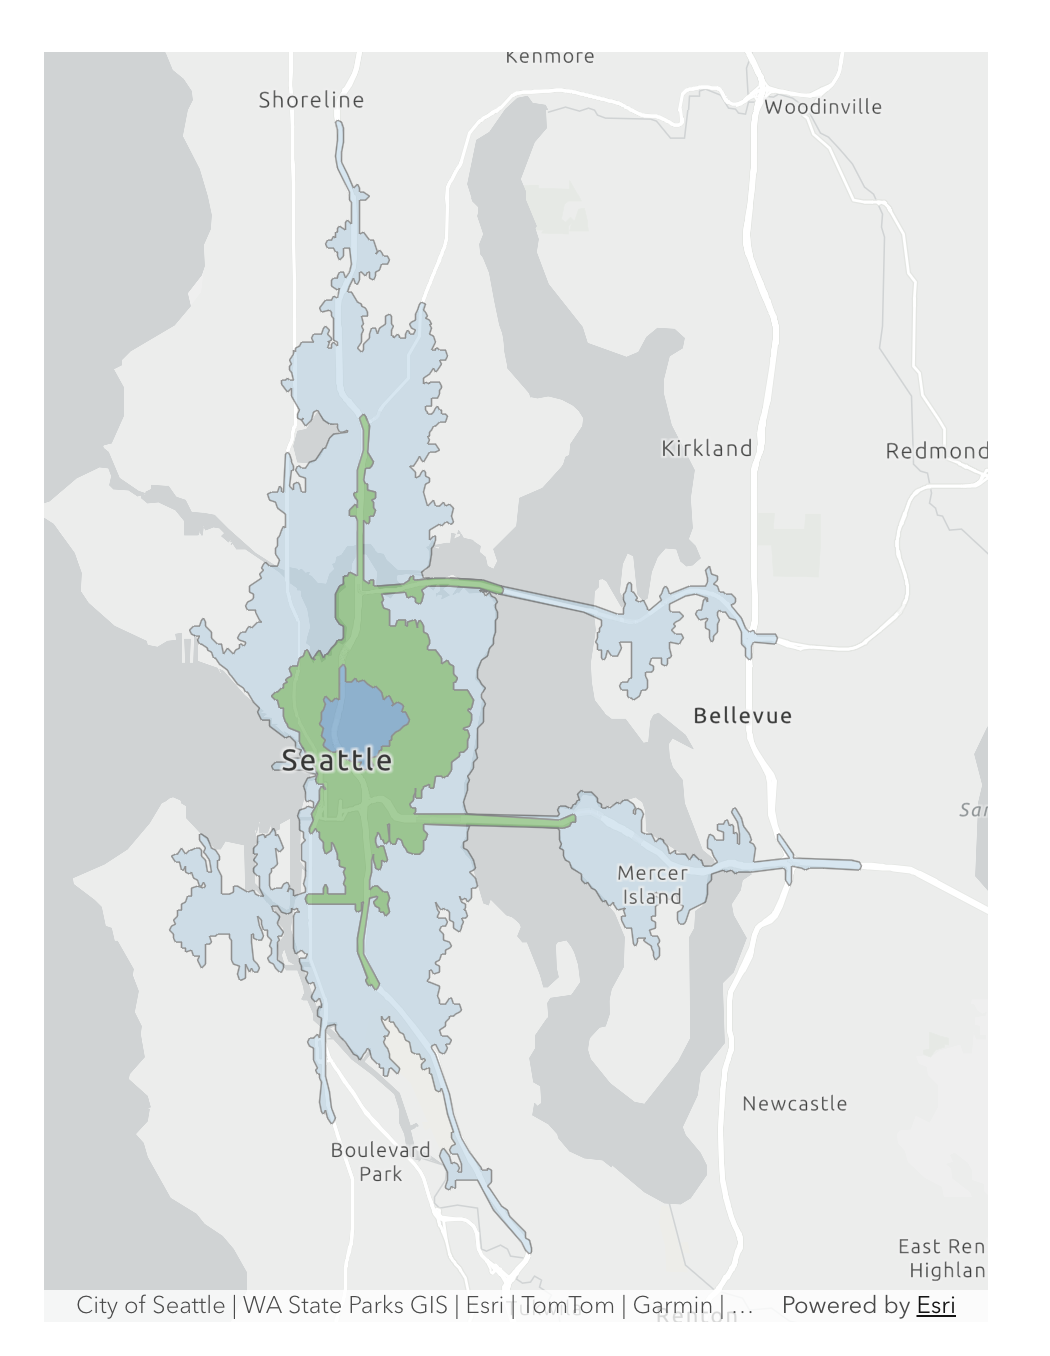
We can use the {arcgisrouting} package to calculate driving time from downtown Seattle in increments of 5, 10, and 15 minutes.
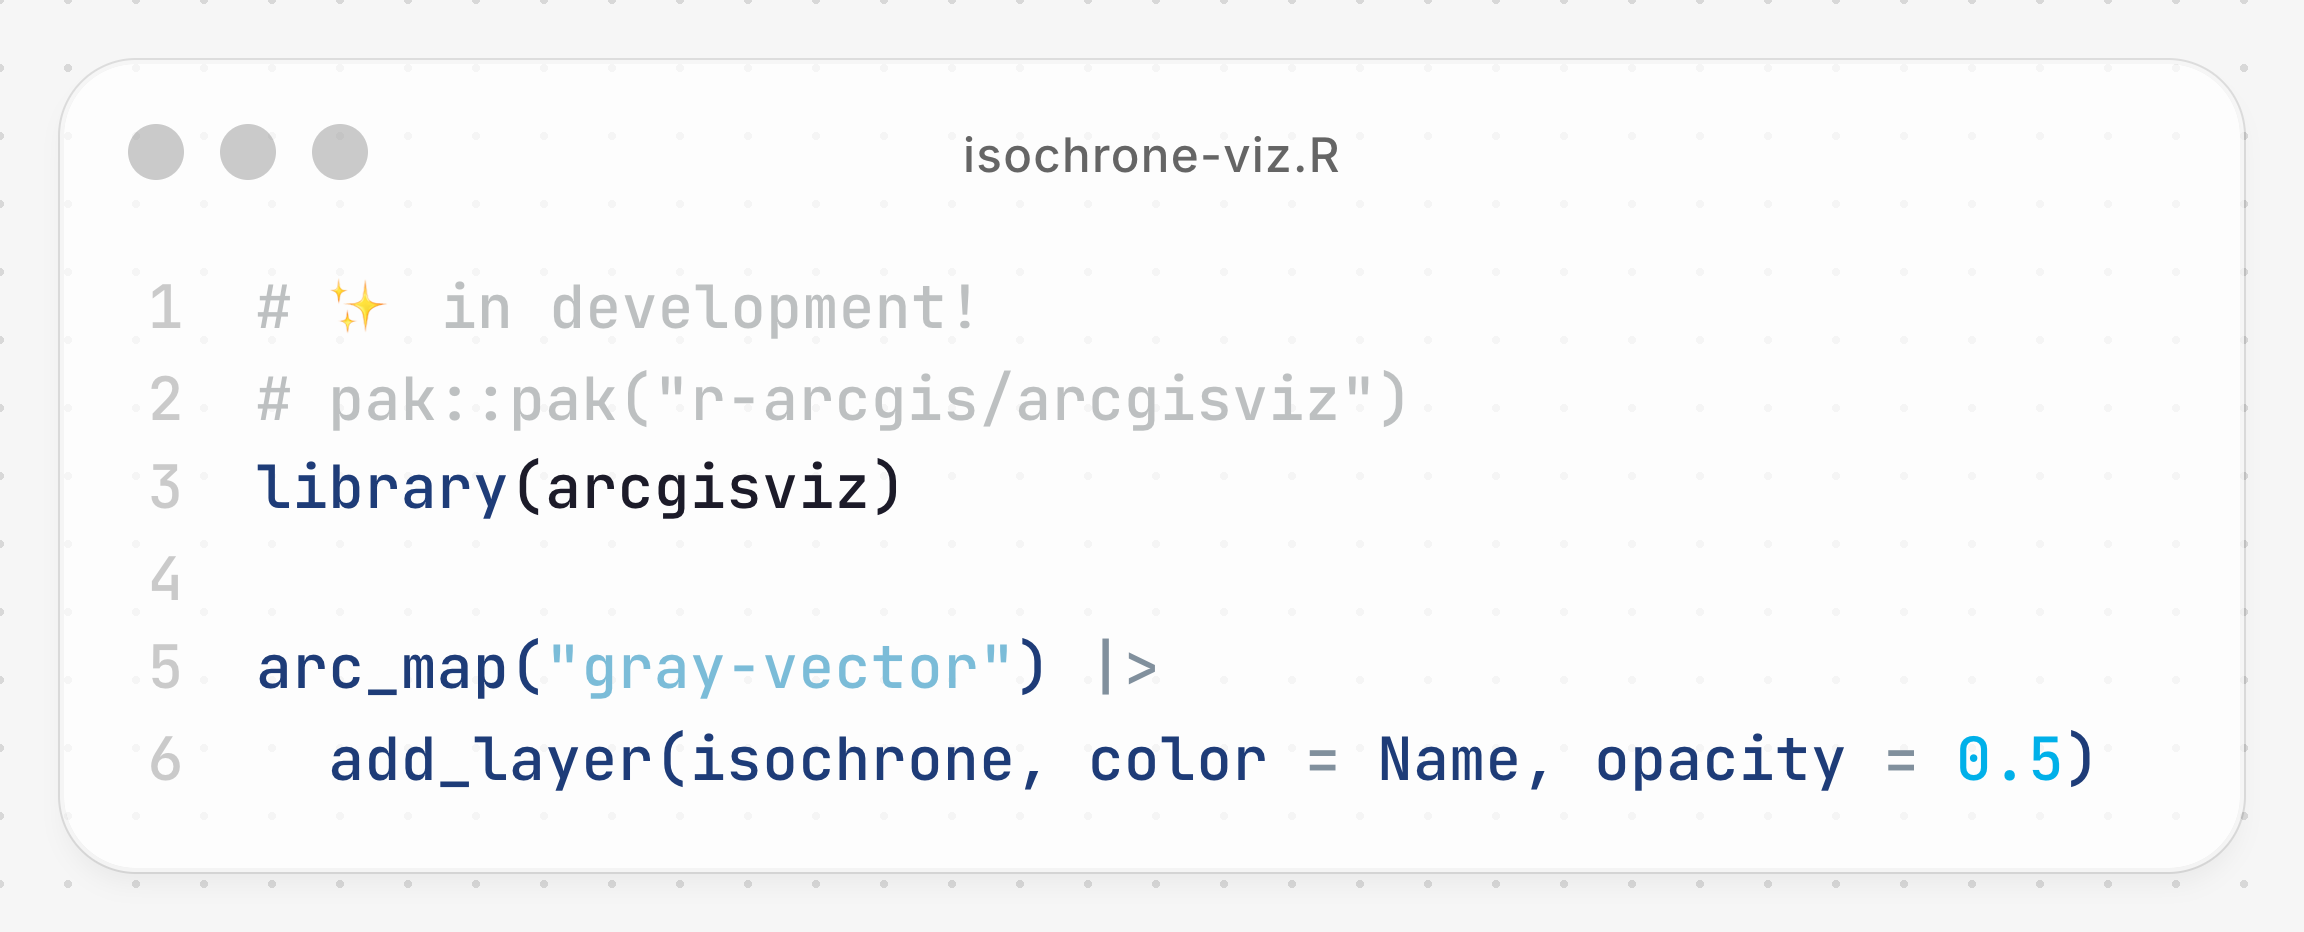
And as a special preview of what we are working on, we can visualize the result in a webmap using the currently-in-development package {arcgisviz}.





Article Discussion: