With more satellites than ever monitoring our planet, the volume of available remote sensing data is growing rapidly. This creates opportunities for organizations to integrate satellite imagery into software applications that support critical workflows in sectors such as agriculture, forestry, climate monitoring, and more. ArcGIS Maps SDK for Flutter (aka Flutter Maps SDK), one of several SDKs that Esri provides for native app development, gives developers tools to visualize, interact with, and analyze raster data, including satellite imagery, directly within mobile or desktop applications.
In this blog, I’ll show you how to integrate imagery from Esri’s hosted Sentinel-2 image service into a mobile app using the Flutter Maps SDK. You’ll learn how to query the image service using parameters like location, date and cloud cover, and how to display the results with an interactive, time-based slider. The result is a custom-made mobile application that can be used to visually monitor the changes in the landscape over time, such as tree foliage changes across the seasons.

Before we dive into the code, let’s look at what rasters and image services are, and why they benefit software developers building native applications that work with satellite imagery.
Rasters and image services
Rasters are a fundamental geospatial data type, representing geographic information as a matrix of pixels. Each pixel holds a value which corresponds to a specific location. These values can represent various data types such as spectral bands, elevation, temperature or categorical classifications. For example, in a digital aerial photographic image, each pixel typically contains RGB values which can be used to display true-color imagery. In satellite imagery, multiple spectral bands (including those beyond the visible spectrum, such as near-infrared) are captured in each pixel. These bands can be used to analyze vegetative health, water body delineation, and land cover classification.

An Esri image service is a web service that provides access to raster data (such as satellite imagery) directly in your application. Instead of downloading large datasets, you can request just the specific areas, dates, cloud cover levels, etc. that you need, when you need them, which the service then sends to you on the fly. This approach enhances performance and scalability, especially for applications requiring dynamic access to large or frequently updated raster datasets.
Sentinel-2 Image Service
Sentinel-2 is a satellite mission from the European Space Agency (ESA) that captures high-resolution imagery of Earth’s surface, useful for monitoring vegetation, water, land use, and more. Esri provides access to the Level-1C Top of Atmosphere imagery through the Sentinel-2 Image Service, which is updated daily. The raster data from this image service consists of multispectral 13-band images with visual renderings. By default, it renders natural color (bands 4, 3, 2), but developers can explore other band combinations by using the 21 available raster functions (such as Agriculture and Color Infrared).
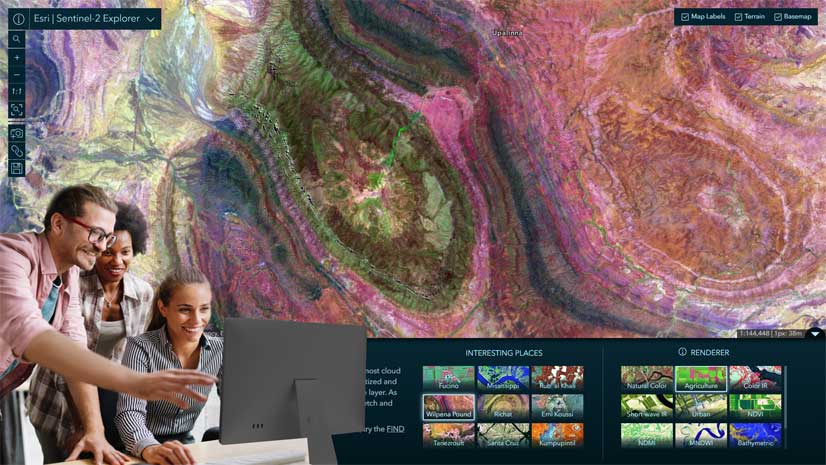
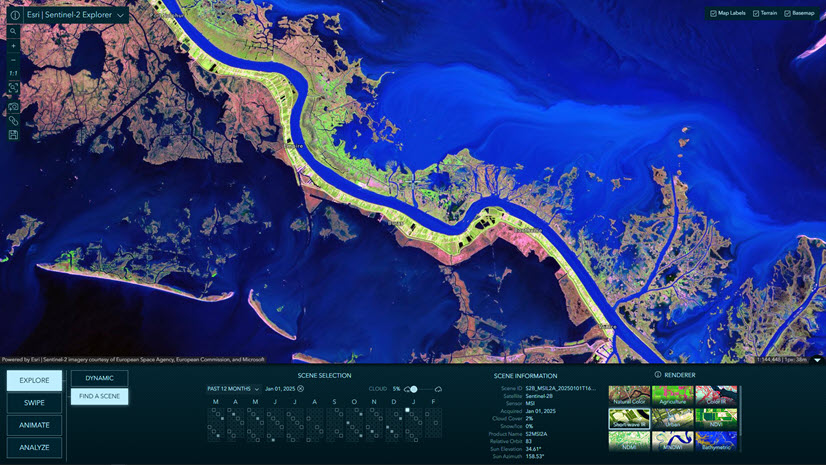
Note that Sentinel-2 Level-2A data is also available and viewable with the Esri Sentinel-2 Explorer web app (see below).

If you’re looking to integrate satellite imagery into your apps, using image services like Esri’s Sentinel-2 image service makes it easy to deliver responsive, visually rich remote sensing experiences in your native apps without having to manage or download large datasets. With support for date filtering, cloud masking, and server-side raster rendering, all you need is an image service URL and a geographical extent to get started with Flutter Maps SDK.
Now that we understand some raster and image service fundamentals, I’ll step through how to display satellite imagery from the Sentinel-2 image service in a mobile application using Flutter Maps SDK.
Building a satellite imagery viewer app
The mobile app we’ll build is for a user who wants to visualize how tree foliage cover changes throughout the seasons in a forested area of Laurel Ridge State Park, Pennsylvania, in the USA. The app allows the user to control which satellite imagery is retrieved by selecting a cloud cover filter and a start and end date of imagery to be viewed. It’s beyond the scope of this blog to go into the app’s UI controls and Flutter state management, but you can check out the full code on my GitHub repo to see how that all hooks together.
Note, even though I’m using Flutter Maps SDK throughout this blog, the concepts and workflows that follow are the same for the other ArcGIS Maps SDKs for Native Apps (.NET, Kotlin, Qt, and Swift).
Install Flutter Maps SDK
First, you’ll need to install Flutter Maps SDK and sign up for an API key if you don’t already have one. Learn how to install and get a key on the Get Started doc pages, then follow the steps in the Display a Map tutorial to create a basic map app template to build upon. The tutorial walks you through how to import the arcgis_maps package from pub.dev, set your API key, and display a map.
How to set up the map view
Now you have a basic map app set up, so it’s time to configure the code for our satellite imagery. In our app, the map provides the spatial context for the satellite imagery. Since we’re working with raster data, the underlying basemap style will be obscured once it’s loaded. Let’s go for a dark gray base map style which matches the app’s dark themed welcome screen:
_map = ArcGISMap.withBasemapStyle(BasemapStyle.arcGISDarkGrayBase);
_mapViewController.arcGISMap = _map;
Now that we have a basemap, we need to define the bounding box (envelope) of the geographical area we want satellite imagery from. We’ll create an envelope which takes the x and y min and max co-ordinates and use the envelope to set the viewpoint of the map view. We’ll also use these coordinates later to request the satellite imagery:
_envelope = Envelope.fromXY(
  xMin: xMin,
  yMin: yMin,
  xMax: xMax,
  yMax: yMax,
  spatialReference: SpatialReference.wgs84,
);

 _mapViewController
    .setViewpoint(Viewpoint.fromTargetExtent(_envelope.extent));
As image services render on the fly, panning and zooming the map view to an area outside the original extent will trigger a redraw of the imagery which can take time. To avoid unnecessary redraws and improve the user experience of viewing imagery in just one area (Laurel Ridge State Park), let’s lock the map view by disabling interaction with:
_mapViewController.interactionOptions.enabled = false;
How to query for available satellite imagery
Now that the app is set up to display a dark gray basemap in the area we’re focusing on, it’s time to find out what imagery is available for that area from the image service.
For this app, I want the user to be able to view satellite imagery available within their chosen extent. I want them to be able to filter by how much cloud cover the image has, and by the date on which the imagery was acquired. You can use the image service REST directory to check what fields are available to filter on – in our case the fields cloudcover and acquisitiondate are important.

Tip: Clouds obscure Sentinel-2 imagery, so for the best images you should ideally filter for cloud free imagery by using a value of 0 for
cloudcover. However, in hilly regions such as Laurel Ridge State Park, it’s rare to have many cloud free days and so long gaps may occur between cloud free images. For this app I’ve therefore incorporated a 5% and 10% cloud cover filter for the user to explore.
We can encode and pass values for cloudcover and acquisitiondate into the image service’s REST query as a where clause to find out how many images that match the user’s filter are available, and importantly, what is the relevant raster image object ID. The objectid is what we will need to later display individual raster images on our app. We will also pass the geometry extent we set up earlier as parameters to limit the query to our specific area.
Tip: If we didn’t pass in a geometry extent, we would retrieve satellite imagery across the whole globe for our given cloud cover and date filters.
Then, we set the outFields to define the attributes we want to retrieve from the service, specifically acquisitiondate, cloudcover and objectid.
    final whereClause = "acquisitiondate >= DATE '$start' "
        "AND acquisitiondate < DATE '$end' "
        "AND cloudcover <= $_selectedCloudCover";

    final encodedWhere = Uri.encodeComponent(whereClause);

    final uri = Uri.parse(
      'https://sentinel.arcgis.com/arcgis/rest/services/Sentinel2/ImageServer/query'
      '?where=$encodedWhere'
      '&geometry=$xMin, $yMin, $xMax, $yMax'
      '&geometryType=esriGeometryEnvelope'
      '&inSR=4326'
      '&spatialRel=esriSpatialRelIntersects'
      '&outFields=acquisitiondate,objectid,cloudcover'
      '&returnGeometry=false'
      '&f=json',
    );
When we make a query to the image service with those parameters, we get a response that returns the requested outFields for any rasters matching the required inputs.
The app is now set up to quickly check what images are available from the image service for the given geometry, cloud cover, and acquisition dates. This workflow of quickly querying the service allows the app to remain fast and responsive and give the user flexibility over choosing filters without loading unwanted imagery, saving time and memory.

How to display raster images
Now that we know which rasters are available from our query, the next step is to display them on the map. We do this by creating a new ImageServiceRaster object for each available raster using the Sentinel-2 image service URI, then setting a mosaic rule (specifies how a collection of raster datasets, such as those available through the image service, are displayed) to the image service raster and applying a where clause to it. This limits the imagery to a single result using the image’s object ID we retrieved earlier.
Tip: If we didn’t supply this where clause, we would be retrieving all rasters available within the map view space, which would be bandwidth and time costly.
Finally, create a raster layer from that result and add it to the map’s operational layers.
Note: To optimize performance and to avoid requesting and redrawing multiple raster layers containing the same raster, the app checks whether a raster has already been added to the map’s operational layers using its unique objectID. The app won’t request the raster again if it’s already there. Check out the code in my Github repo learn more.
final raster = ImageServiceRaster(
  uri: Uri.parse('https://sentinel.arcgis.com/arcgis/rest/services/Sentinel2/ImageServer'),
);

raster.mosaicRule = MosaicRule()
  ..whereClause = 'OBJECTID = $objectId';

final rasterLayer = RasterLayer.withRaster(raster)..name = layerName;
await rasterLayer.load().whenComplete(() => map.operationalLayers.add(rasterLayer));
How to configure the interaction with the map
Now that the app is configured to fetch and display rasters from the image service, it’s time to configure the user interface to display the results. Below, I’ll briefly summarize the key components as it’s beyond the scope of this blog to go into the full details of Flutter UI configuration (but remember you can check out the full source code in my GitHub repo for this app).
To create a responsive and intuitive experience, you can connect the map view controller’s draw status to your Flutter UI. Since multiple satellite imagery requests can take time to draw, it’s useful to listen in to the map view controller’s draw status event to coordinate your UI elements. For this app, a slider widget is used to allow the user to browse the displayed satellite images. By listening in to the draw status, you can temporarily hide interactive widgets like the slider while the map loads new data. You can then reveal the slider again once rendering is complete and interact with it to browse the images loaded. This ensures that the user interacts only with fully loaded content.
    _mapViewController.onDrawStatusChanged.listen((event) {
      if (event == DrawStatus.completed) {
        markLayerDrawnIfComplete(layerName);
      }
    });
Once the raster layers are ready, the user can interact with the slider to view different rasters. As the slider’s index changes, the app updates the visible raster layer by setting the visibility Boolean property on the layer accordingly.
    for (final layer in _map.operationalLayers.whereType<RasterLayer>()) {
      layer.isVisible = false;
    }

    if (selectedLayer != null) {
      selectedLayer.isVisible = true;
    }
Once you’ve hooked in the UI operations to the raster filtering and selection logic, you have an app powered by Flutter Maps SDK that allows your user to quickly browse satellite imagery from an image service, display it on the device, and interact with the results – all on a mobile device without requiring access to desktop software.

The user of this app can now easily see the changes in autumn foliage over time at Laurel Ridge State Park. This capability could be used for anything from planning a sightseeing trip to see the colors at their best (mid October looks like peak time!) or to understanding how elevation affects the speed of foliage fall in the area.

Integrating raster functions into the app
By default, the Sentinel-2 image service renders rasters in natural color, which closely resembles what the human eye would see. This visualization is a great starting point for general exploration, but because Sentinel-2 imagery contains multiple spectral bands, the imagery can also be rendered in several other ways depending on your user’s needs. This process of rendering can be controlled using raster functions which are operations that apply processing directly to the pixels of raster datasets.
The image service provides a range of predefined raster functions that allow you to dynamically change how the imagery is visualized. You can browse the raster functions available for the Sentinel-2 image service on its rasterFunctionInfos URL. For example, you could apply the Color Infrared with Dynamic Range Adjustment (DRA) function to emphasize vegetation health and seasonal change, making shifts in foliage across autumn far more pronounced than with natural color alone. Here healthy vegetation appears bright red, while areas of stressed or no vegetation appear dull red or brown. You can apply this visualization via a rendering rule with the following code:
  imageServiceRaster.renderingRule = RenderingRule.withRenderingRuleJson(
      jsonEncode({
        'rasterFunction': 'Color Infrared with DRA',
      }),
    );

In the above image, this Color Infrared raster function shows the user that the area was covered in healthy living vegetation on 12th September. Then in the second half of October, the user sees rapid changes as the leaves die and fall from the trees. By the end date of 27th October, evergreen vegetation present beneath the now bare trees can be seen where it was obscured before.
This rendering flexibility gives you the ability to tailor the imagery to your use case, whether it’s monitoring vegetation, identifying urban features, or visualizing moisture content – all without needing to preprocess the data manually.
Beyond image services
A quick visual analysis is great, but if you want to go beyond visualizing and processing raster data from image services, such as quantifying the data to chart and compare vegetation changes over time, you can use the Raster API tools available from ArcGIS Maps SDKs for Native Apps. These tools let you apply a range of raster functions on rasters stored on the device (such as applying hillshade renderers to single band rasters like digital terrain models), and identify pixel values when interacting with a raster. You can check which raster functions are supported on the Esri Developers website (note, these are limited in number compared to those which may be available on image services). If you want to perform deeper statistical analysis, check out the ArcGIS Python API or the Raster Analysis service to build more advanced workflows.
Conclusion
In this blog I’ve stepped through how to use Flutter Maps SDK to create a mobile application that displays filtered and pre-processed satellite imagery from the Esri hosted Sentinel-2 Image Service. You’ve learned a little about rasters and ArcGIS Image Services along the way too. Image services such as these allow developers to provide powerful imagery capabilities to their apps, backed by scalable, cloud hosted services and flexible client-side rendering. Quick visualization and server-side processing of rasters ensures seamless access to massive and constantly updated datasets without taking up local storage on the device.
What I’ve covered in this blog is just a small part of how you can manage working with rasters using Flutter Maps SDK (or any of ArcGIS Maps SDKs for Native Apps). For example, you can also render multiple rasters simultaneously and control their filtering order using mosaic rules. You can also work with locally stored raster data offline and apply raster functions to the data, such as applying hillshades to single band rasters or using raster calculator to calculate indices such as Normalized Difference Vegetation Index (NDVI), used to quantify vegetation greenness.
You can learn more about working with rasters in Flutter Maps SDK in the Add Raster Data documentation pages. Check out the following Flutter Maps SDK samples to learn more about how to build mobile apps using raster data (samples are also available for the other Native Maps SDKs):
- Add raster from file || Add raster from service || Apply mosaic rule to rasters || Apply colormap renderer to raster || Apply function to raster from file || Apply raster rendering rule || Identify raster cell
Finally, you can find the source code for the app shown in this blog on my GitHub repo and use it as inspiration to build your own apps powered by satellite imagery!
Credit: Images throughout this blog contain Copernicus Sentinel data 2024.

Commenting is not enabled for this article.