With the ever-increasing availability of digital elevation model (DEM) data, and its resolution becoming finer and finer, some data can become overly detailed for the phenomena we are trying to model. For example, classifying a fine-resolution DEM raster (1-meter or less in cell size) into landforms can lead to small bumps being identified as peaks. In this case, such small features on the ground are typically more detailed than we need. One of the common workarounds to this has been to resample the DEM to a larger cell size as a preprocessing step. However, resampling can also reduce the fidelity of the data or introduce artifacts. Is there another way to deal with this?
Introducing at ArcGIS Pro 3.4 and ArcGIS Enterprise 11.4, the Feature Preserving Smoothing (Spatial Analyst) tool allows you to remove small fluctuations and noise on an elevation surface while preserving the structure of landscape features. The original ideas behind this tool were conceived and developed in consultation with John Lindsay and first appeared in his Whitebox software. Other benefits of the tool include the following:
- Parameters are available to set the neighborhood size, as well as the maximum curvature and height changes allowed during the smoothing process.
- While the tool runs fast on most elevation surface data, it is also capable of taking advantage of a GPU device if one is available on your computer.
- While in most cases you can run the tool by just specifying the input and output parameters and accepting the other parameters as default, it can also be run in an iterative mode. This allows you to easily tweak the parameter values to arrive at the desired outcome.
How does it work? The tool views the input surface as a landscape with features such as mountains and valleys, or small bumps and sink holes. Each feature has a size and height, with edges of a certain curvature. The algorithm then makes small adjustments to the curvature and height of features to achieve the desired degree of smoothness.
Neighborhood distance and distance units
The Neighborhood Distance parameter is used to set the moving window size of the smoothing kernel. It is defined as a radius measuring from the center of the neighborhood to the orthogonal edge of the neighborhood. The Distance Units parameter allows you to specify the units in which the neighborhood distance is measured. The Cells option allows the neighborhood distance to be measured using the number of cells, while the rest of the options allow it to be measured using a linear unit.
There is no need to specify a large neighborhood distance value. A small value (such as the default value, 5 cells) ensures the algorithm focuses more on local variability and only smooths away noise-like features. If you want to increase the output smoothness, tweak the Normal Difference Threshold and Maximum Elevation Change parameters as explained below.
Curvature preservation
The Normal Difference Threshold parameter sets the level of curvature preservation during the smoothing process. The smaller the value, the fewer changes will be made to the curvatures on the DEM, and the better the feature edges will be preserved.
With a higher Normal Difference Threshold setting, typically the output appears smoother because more edges are smoothed away. For example, the images below show the effect of this parameter on the output. From left to right, the first image is the original DEM (with 1-meter resolution), the second image shows the output with a Normal Difference Threshold value of 5 degrees, and the third image shows the output with the value set to 30 degrees.
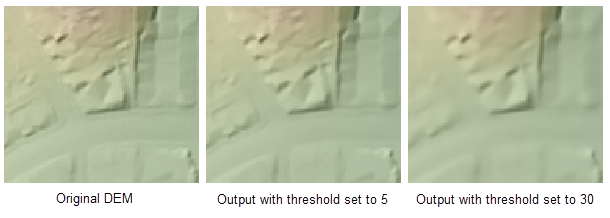
While the valid value range for this parameter is between –180 and 180 degrees, a small value (such as the default value, 15 degrees) should be used in most cases to ensure the preservation of feature edges.
Height preservation
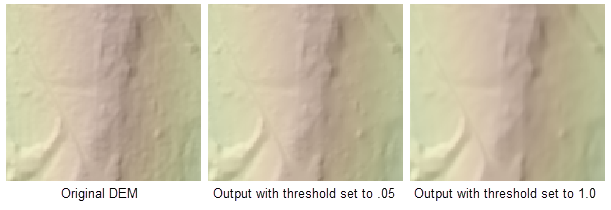
The Maximum Elevation Change parameter defines a threshold for the allowed maximum height change at any cell location. Features with heights above this threshold will be preserved. Features with heights below this threshold can potentially be smoothed away. You can adjust this parameter to control the level of height change that the smoothing process will handle.
With a higher Maximum Elevation Change setting, typically the output appears smoother because the height changes are more significant. For example, the images below show the effect of this parameter on the output. From left to right, the first image is the original DEM (with 1-meter resolution), the second image shows the output with the parameter set to a value of 0.05 meters, and the third image shows the output with it set to 1.0 meters.
Examples
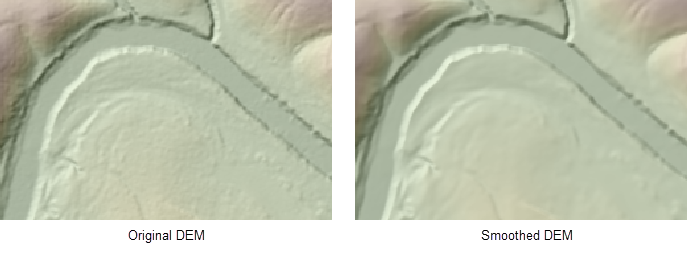
Since the small fluctuations have been removed, the output raster will typically look smoother than the input raster. To view the effectiveness of the smoothing process, create hillshades for the before and after rasters, then compare them. The images below are an example created using a 1-meter resolution DEM.
The output raster can also be used in a subsequent tool to increase the output smoothness. The following images show the outputs from the Geomorphon Landforms tool using the original DEM and the processed DEM, respectively.
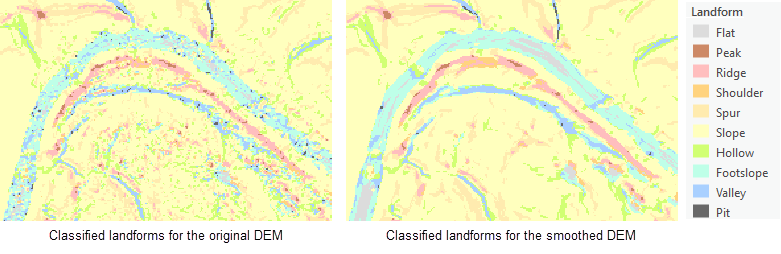
The above examples illustrate the applications of the tool in surface analysis. This tool is also particularly useful as a preprocessing step for elevation derived hydrography workflows using high resolution DEMs.
Learn more
To learn more about the Feature Preserving Smoothing tool, see How Feature Preserving Smoothing works.

Article Discussion: