It’s September and we are in the middle of hurricane season. Data collected over the past century shows that climate change has elevated Earth’s air and water temperatures. Increasing temperatures have fueled more intense storms, including the back-to-back hurricanes that devastated the Caribbean in 2017.
Mapping data that spans dynamic time periods, with overlapping areas, and variable levels of measurement is difficult. To help viewers make the connection between the increasing frequency and intensity of severe cyclones over a 177-year long period of time, the ArcGIS StoryMaps and Living Atlas Environment teams recently published a story about Tropical Cyclones using 3D data.
The 3D approach enables viewers to see patterns in global data and across a long period of time that may be obscured when displayed on 2D map. While this particular use case involves hurricanes, using 3D visualizations can work for summarizing many large datasets and continuous or live feed data as well. This blog will explain why we chose to display the hurricane data in a three-dimensional format and offer some introductory steps to telling your own story with this type of data.
First among those steps is to line up good sets of data.
The ArcGIS Living Atlas: A repository of spatial data
Have you discovered the ArcGIS Living Atlas of the World? Access this global resource for ready-to-use, authoritative data layers that are curated and prepared for seamless integration into your own workflows from within the Esri platform. The Living Atlas includes data from thousands of organizations that contribute their own layers, maps, apps, and stories with content that can spark the interest of every GIS user and storyteller worldwide.
The resources within Living Atlas are available in both ArcGIS Online and ArcGIS Pro as shown below.

We created the Tropical Cyclones story using two Living Atlas feature layers that are available from the National Oceanic and Atmospheric Administration (NOAA). These global layers are drawn from historical archives of cyclones or hurricanes since 1842 and are continuously updated through the previous calendar year (2019, at the time of this project). We used two feature layers: Historical Tracks and Historical Points. Each layer contains attributes that are rich in information, such as a storm’s name, date, maximum wind speed, pressure, and monitoring basin.
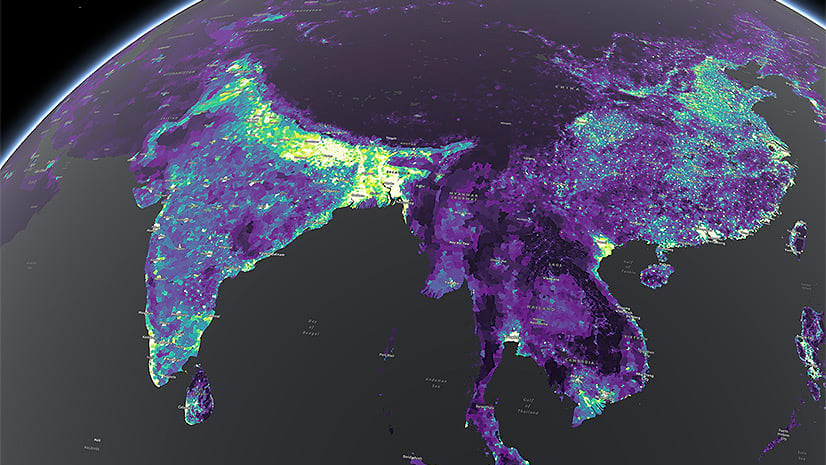
The beauty of using Living Atlas layers is that you can run your own analysis on them just as you would with your own local layers. For this project we used dynamic feature binning, a method for visually aggregating large amounts of data, to make sense of this:

Feature binning works great when dealing with 671,093 track lines and 684,363 points! Binning clusters your data into equal hexagons that allow you to visualize patterns that emerge from your data related to space and time Almost instantly hotspots emerge, and for this project, the seasonal pulse of cyclones worldwide came to life:

Choosing 3D visualization
Before embarking down the 3D road, it’s always a good idea to stop and ask yourself “To 3D or not to 3D?” Will using 3D add additional insight into the “story of the data” or is it a visual (or navigational) distraction? Is the extent of the dataset suitable to exploring in a global 3D view? The eight questions posed in the blog post by Mark Harrower linked above are useful concepts to keep in mind; sometimes a 2D map is a more effective communication tool for the data you’re working with.
In the case of hurricane tracks, though, using 3D visualizations allows us to more clearly and dramatically see the changes in severity and pace over a storm’s life. While relating hurricane data in 3D is not brand new, we came up with a new way to visually convey the data.
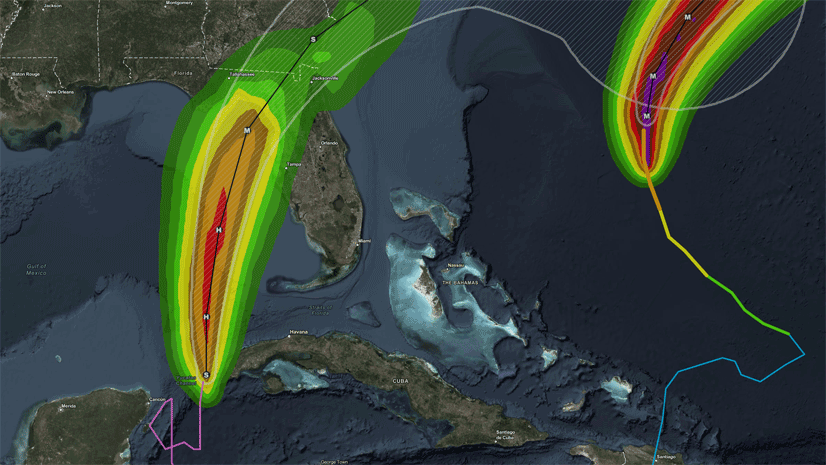
We wanted to create visualizations that accentuate the feelings of strength and danger evoked by the larger and most dangerous storms from recent history. The symbology should, at a glance, clearly communicate the most important attributes of a storm: wind speed, storm speed, storm duration, and storm intensity/category. To achieve our project goals and optimize the information in the dataset, we stretched each of the 2D track lines vertically and used a combination of 3D symbols for each track––a look that was partly inspired by a COVID-19 stay-at-home craft project: stained glass!
")
Each 3D storm track is made up of three parts:
- Track panels: The lines tracking the path of cyclones are extruded vertically by the wind speed (multiplied by 1000) and colored according to the Saffir-Simpson hurricane scale, from Tropical Depression to Category 5. White edge-rendering is turned on in the web scene to clearly differentiate each time step in the storm’s path, giving the panels a “stained glass” look.
- Daily cyclone progress symbols: These 3D symbols are placed on the track every 24 hours at 12:00 AM UTC time and show how quickly the storm is moving and are colored according to the Saffir-Simpson scale.
- Storm labels: The storm name labels are placed on the track at the first occurrence of the maximum wind speed.
 and category (color). The distance increases between daily progress labels as Maria picks up speed but loses intensity as it heads east across the Atlantic Ocean.")
Even without consulting a legend, understanding the lifecycle of each storm is intuitive with this 3D symbology. Incremental increases in wind speed as the storm builds are shown as noticeable vertical “steps” in the track panels. As the storm slows down, both the daily cyclone symbols and the panel borders contract and narrow. While it can be difficult to compare relative feature heights in any static 3D view because of the distance and inclination of the camera, the Saffir-Simpson category colors help reinforce the relative intensities for distant tracks. And like any web scene, the ability to explore and discover the dataset interactively in 3D is worth a thousand screenshots.
Note that to create and publish the 3D data you do need to use ArcGIS Pro, which can also perform other visualizations including 3D cross sections, fence diagrams, and 3D lines. It’s also worth mentioning that we brought in outside software to add in some details to the map. We created the 3D symbols showing the daily cyclones using Sketchup. We added the annotations on layers using Camtasia, and shared the scene layers using ArcGIS Online web scene viewer.
Click on the image below to explore some of the 3D data we created for this story in a web scene!

Ways to package 3D data
Deploying 3D data is challenging as a standalone product. It’s immersive and visually appealing, but it sometimes needs more context in order to be understood by readers. One of the easiest ways to ensure your 3D data is properly deployed is to use ArcGIS StoryMaps. When you wrap 3D data in a story, you can give proper context to your data, include any additional information needed to understand it, and provide detailed descriptions of what it depicts. ArcGIS StoryMaps allows you to tell the story of your data, instead of just putting it out into the world in as a standalone web scene with slides or a video.
Three different ways to incorporate 3D data into a story include:
- A web scene: Using an interactive web scene to display your data works best for lighter 3D data layers, or layers that have a more regional extent. Directly embedding a web scene in a story can lead to a risk of having it load slowly or lag, which can create a subpar reader experience. It can also cause readers to feel overwhelmed when left to their own devices to attempt navigating through voluminous data. Use this option judiciously!
- A slide or screenshot: Using a static image of your 3D data in your story is an option that’s great for heavy datasets that can be easily illustrated in 1-3 slides/images. Incorporating these into an immersive block like sidecar or slideshow will go a long way. You’ll cut down on loading time, your reader won’t get stuck in your immersive data, and you can highlight the important parts in accompanying text while still offering beautiful 3D visualizations.
- A video or animation: Creating a video, animation, or GIF of your data is a great way to illustrate movement or patterns within your data without overwhelming your reader. Ultimately, this was the route we chose for our cyclone story. Creating videos showing movement through different storm histories allowed us to highlight storm paths, temporal variation in storm strength, and pull our readers along on the exact journey we wanted them to see. When deployed at the right moments, this option is incredibly powerful and hydrates your story narrative in a way that is often difficult to achieve with 3D data.
We hope this blog has been illustrative regarding the use of 3D visualizations to tell a story through data and when such a strategy might be more (or less) effective than two-dimensional renderings. The cyclone story is, we feel, a great example of a use case for 3D visuals.
We also hope this blog will inspire you to explore the ArcGIS Living Atlas and take advantage of the possibilities for creating your own 3D project using its datasets.
Resources Collection
Earth’s Biggest Storms: Tropical Cyclones (Story)
Earth’s Biggest Storms: Tropical Cyclones Web Scene


Article Discussion: