This article is designed to assist customers implementing Stormwater utility networks in validating the flow and connectivity of their network data after it has been migrated to a utility network. This is a technical article for advanced users that requires you to be familiar with the terminology and tools available in ArcGIS Pro and ArcGIS Utility Network. The techniques described in this article can be used by technical staff to identify potential data quality issues so they can work with subject matter experts, engineers, and the business to address these problems. You can learn more about the techniques described in this article by reading the Tips for Tracing and Quality Assurance community post on the Esri Community site.
Not all customers rely on Subnetworks to identify the flow direction in their networks. Sewer and stormwater customers have historically relied on the digitized direction of their lines to represent and control the flow of resources in their systems. The Use Digitized Direction parameter for Upstream and Downstream traces allows these customers to trace an area of their network with respect to the digitized direction. The digitized direction tracing capabilities in this section require a utility network with a schema version of 7 or greater.
Integrating this style of analysis into a dataset with subnetworks requires careful consideration for how to use the IsConnected field, how (or if) to use subnetworks, and how to effectively identify data quality issues that result in disconnected features. In this article, you will learn how to answer the following questions using a stormwater network:
- Are there disconnected features in the network?
- How can I visualize flow in the network?
- Are features represented correctly with regards to their digitized direction?
- How do I correct lines that are digitized in the wrong direction?
- How can I use subnetworks for quality assurance?
- Are the overflows/shared areas of flow in your network properly represented?
When analyzing these networks, you are trying to identify how much of the data is connected to the sinks in your network. If you are analyzing a dataset that has many starting points, consider following the steps outlined in the Persisting trace locations section of the Tips for tracing and quality assurance article (referred to as Tips and Tricks article in this document) to streamline the process.
Connected trace
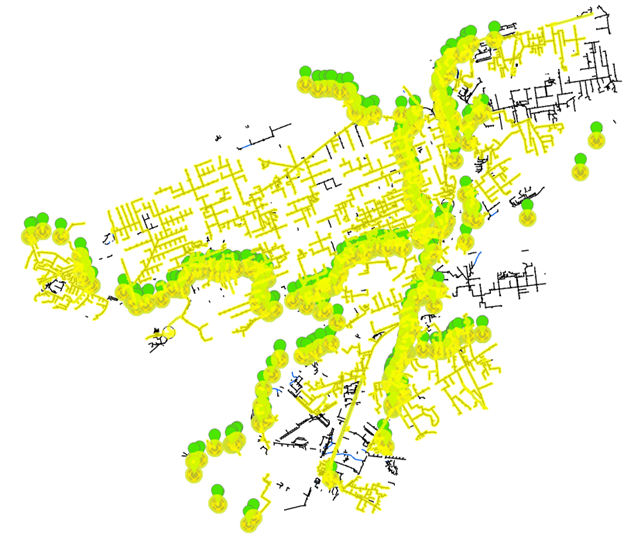
The first thing to assess is how many features are connected in your network. You can answer this by running a connected trace for all the sinks in your network.
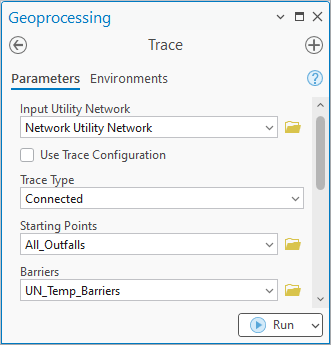
This allows you to quickly identify which features are connected (yellow) and disconnected (black) from your system.
Because you will be referring to this result later, use the approach described in the Aggregated geometry section of the Tips and Tricks article to persist the results in a feature class.
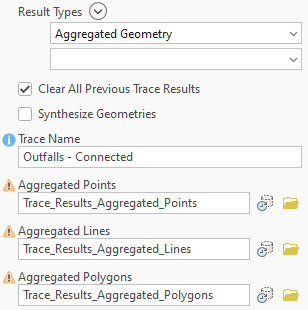
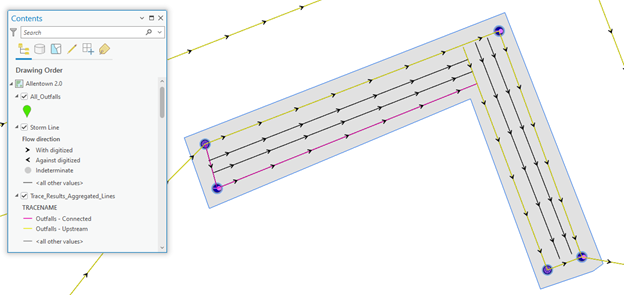
Re-running the trace and persisting the results as an aggregated geometry will add a layer to your map representing the results. Symbolizing the trace results as Pink and all the line features as black will produce a map like the one below.
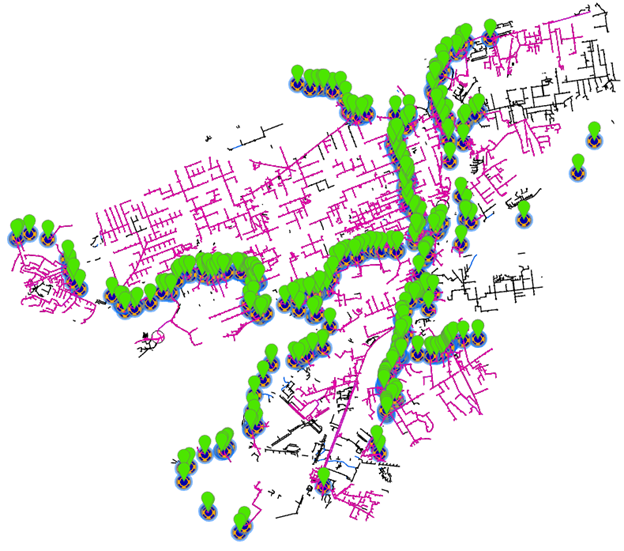
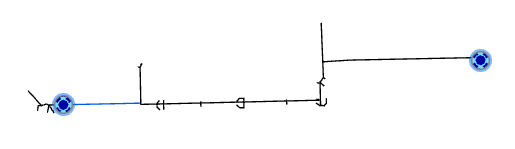
Looking at the results in the above example, you can see when there are disconnected sections of the network without any outfall. The image below shows a section of pipe and open channel that only has pipe inlets.
You can also see locations where features aren’t properly connected to the rest of the system. The example below shows areas of the network that are connected (Pink) with three sets of pipes that aren’t connected to the rest of the system.
These issues will require manual cleanup and investigation to correct. The most common cause of these features being disconnected is snapping issues. That is to say that these features may be overshoots or undershoots. Using ArcGIS Pro to snap the lines should ensure that connectivity is established, especially in cases where the endpoint of one line connects midspan on another line and there isn’t a midspan vertex.
Flow Arrows
While the utility network cannot draw flow arrows using the flow calculated by subnetwork controllers, we can rely on a modeling standard of stormwater data to represent flow. In these gravity-based systems, flow direction is controlled by the effects of gravity, and representing the direction of flow in the system is typically modelled by orienting the line in the direction of flow.
This can be symbolized using the Flow Direction field found line features in a utility network (version 7 or later). To do this use the following instructions.
1. Add the domain line to your map (StormLine)
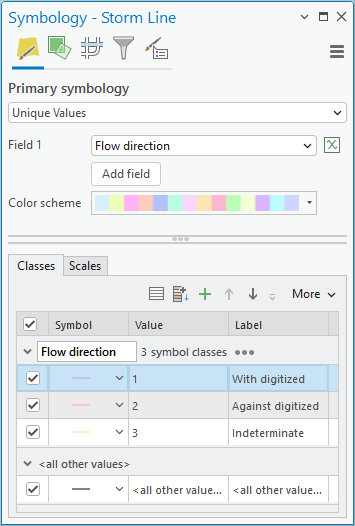
2. Change the symbology from the Asset group field to the Flow direction field.
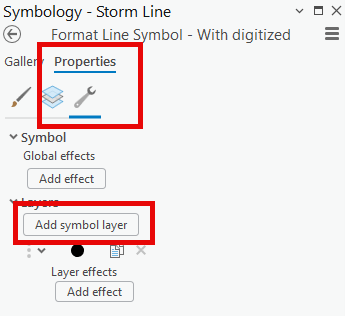
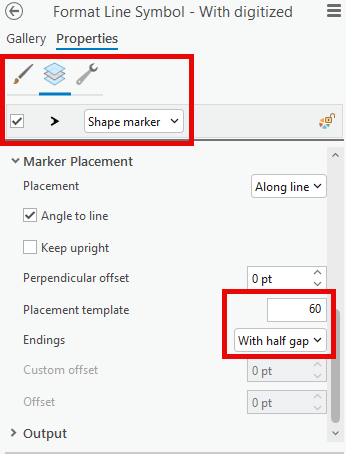
3. Change the symbol properties for the “With digitized” symbol
4. Go to the structure tab for the symbol
a. Add a Marker layer
b. Remove the Stroke layer
5. Adjust the Layer properties for the Marker symbol
a. Use the Esri Arrowhead font to select a symbol
b. Adjust the marker placement settings to your liking
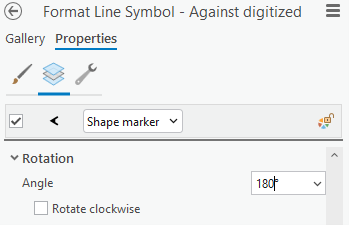
6. Repeat this process for the Against Digitized symbol
a. Set the Rotation to be 180
7. Indeterminate is typically not used but can be set up with a distinct marker symbol if desired.
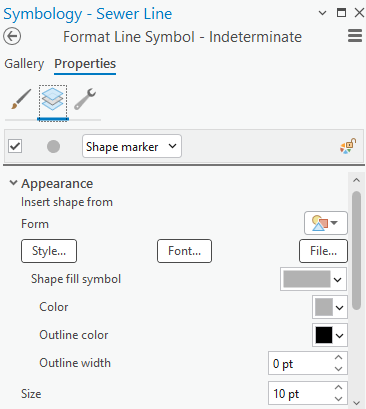
A common symbol for indeterminate flow is a grey circle.
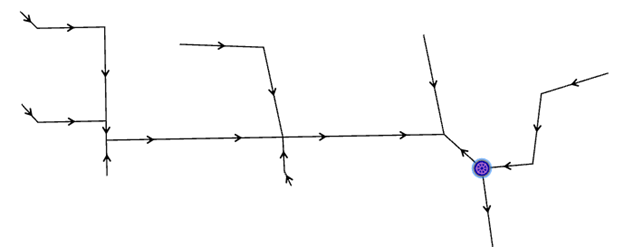
8. Set the Minimum Scale of the layer to be relatively large (1:1000-1:10000)
9. This symbology makes it easier to visually identify flipped lines
You should have a layer configured in your map before performing any quality assurance related to digitized direction of lines or flipping any lines.
Upstream (digitized direction)
Once you have ensured all the features are properly connected to the system using a connected trace, the next thing to evaluate is whether the lines are digitized in the correct direction.
You can validate that the lines in your system are properly oriented by running an Upstream trace from your sinks with the Use Digitized Direction parameter checked.
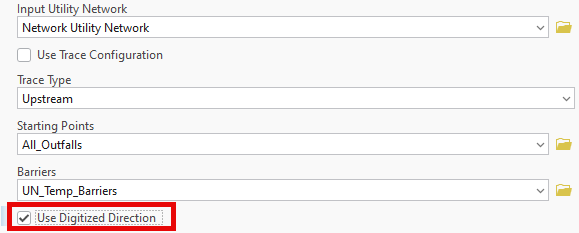
Once again, persist the results in a feature class to make reviewing the results easier. If you put them in the same class as your connected trace results, ensure you give them a unique Trace Name and uncheck the Clear all previous results parameter.
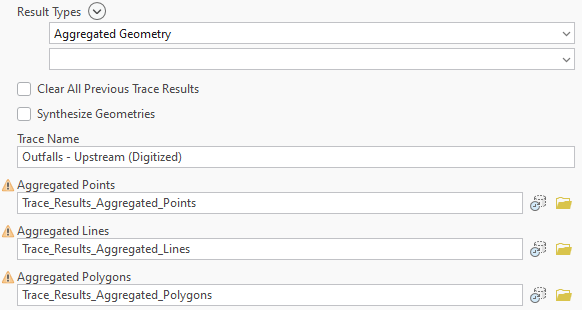
This will traverse upstream from all the sinks in your network, using the digitized direction of lines.
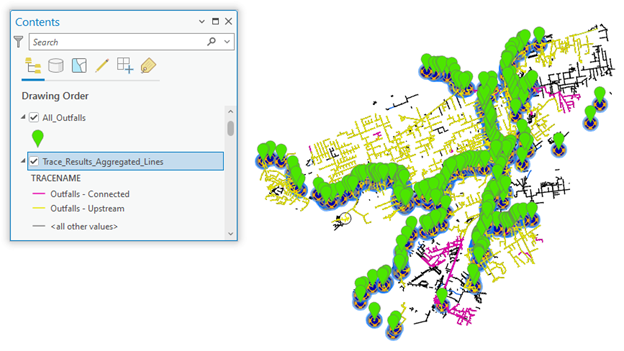
Any locations not covered by this trace (Yellow), that are otherwise connected properly (Pink), are caused by lines being flipped.
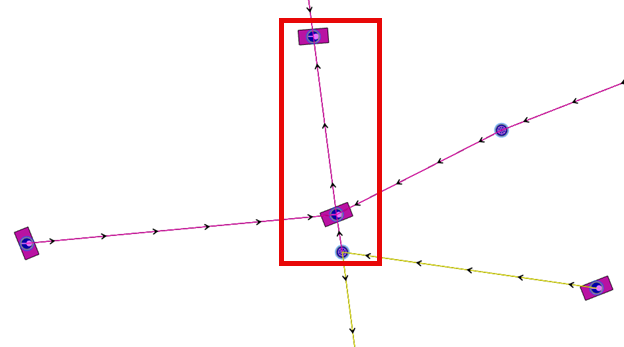
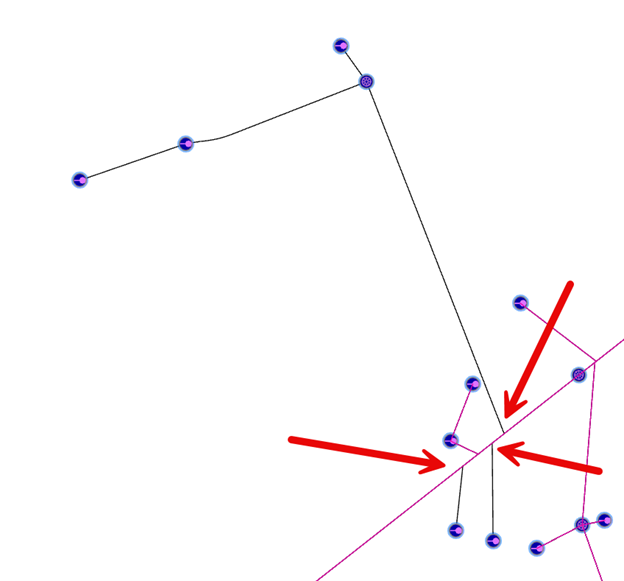
When reviewing these issues ensure you include layers that show flow arrows, connected lines (Pink), as well as upstream lines (Yellow). This allows you to more easily distinguish between lines that aren’t connected due to snapping issues and lines that aren’t connected due to digitized direction. This is important for situations like the example below where there may be a combination of issues.
In the above example, the disconnected (Black) lines aren’t connected to the pipes within the boundary. The connected (Pink) lines are connected on their upstream edge, but not their downstream edge, causing them to not be included in the upstream trace results.
Flipping lines
Flow can be reversed without redrawing lines. Use this to validate flow and connectivity before modifying geometries.
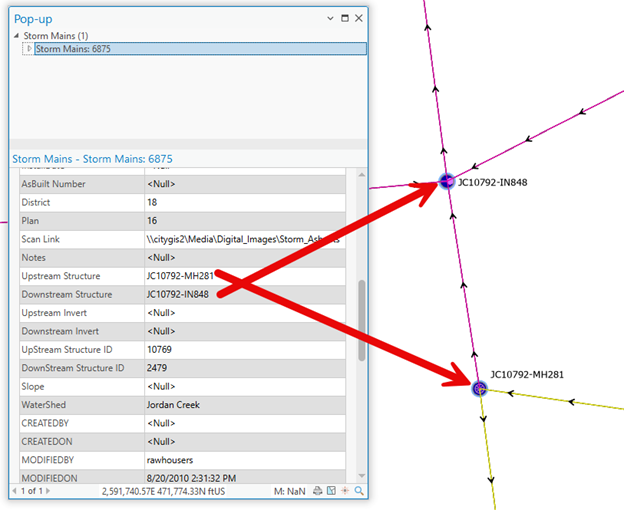
Once flow has been validated, and before you flip geometries, you should review the attributes for any dependencies between attributes and the directionality of the line. This includes fields like upstream/downstream elevation, upstream/downstream node id, or similar fields.
If the fields are correct with respect to the digitized direction of the line, the lines can be flipped. However, in cases where the attributes do not match, they must be updated before flipping the lines.
Lines can be flipped with the Flip Lines tool, but this should be done using the Enable Undo option so you can discard your edits if you make a mistake. If performing the edits in an Enterprise geodatabase, ensure you perform the edits in a branch version and perform normal quality assurance routines before posting the edits.
Subnetworks
Customers who make use of subnetworks for stormwater systems can rely on the SubnetworkName field(s) in addition to the IsConnected attribute to determine whether features are connected and to which subnetwork they are connected. These fields are maintained as part of the normal editing and quality assurance workflow, by running the Update Subnetwork tool.
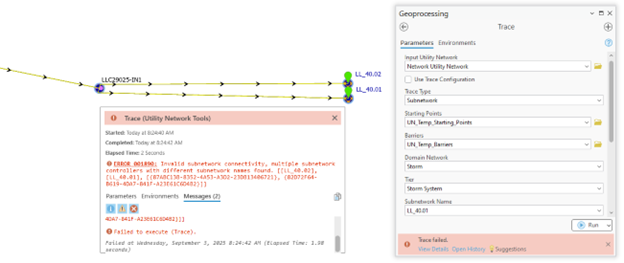
However, it is worth noting that subnetworks do not have an option to respect the digitized direction of lines. This means that adjacent subnetworks that are distinct when considering the digitized direction of lines can fail to trace or update when running a subnetwork trace. See below for an example.
Resolving these issues require that you differentiate the paths between the downstream edges to ensure they are mutually exclusive. There are multiple solutions to this problem, including the use of a terminal configuration with terminal connections and paths to differentiate downstream edges (Directional Manhole) or the use of condition barriers to designate one of the pipe connections as an overflow only to be used during a low/medium/high load (S:Activate Value).
While the solution to the problem will not be described in detail here, the following section will show you how to identify the path between the two subnetwork controllers.
Inconsistent subnetwork names
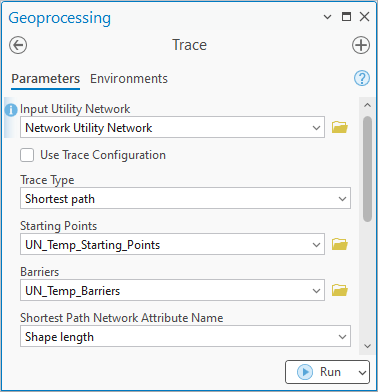
Solving an inconsistent subnetwork name error involves determining the path between two (or more) subnetwork controllers. One of the easiest ways to do this is to use the Shortest Path trace. We will use the following situation as an example:
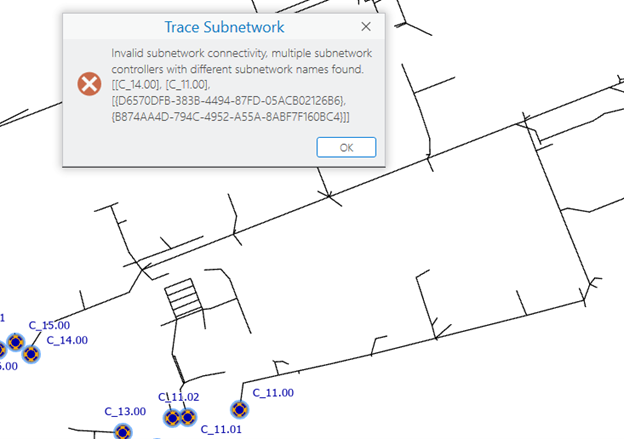
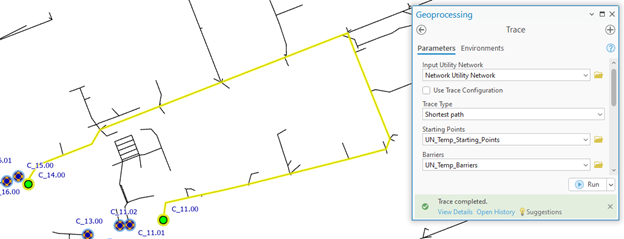
According to the error, the outfalls C_11.00 and C_14.00 are connected to each other. By running a shortest path trace between the two subnetwork controllers, we can find a path between the features.
By default, the trace ignores condition barriers, terminals, and other subnetwork controllers.
You should add the condition barriers from your subnetwork definition to your shortest path trace, so it respects those conditions (then save this as a trace configuration).
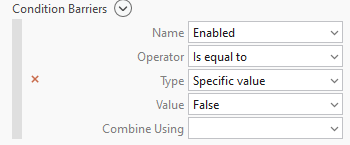
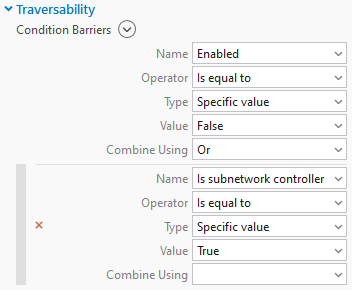
You can also add a condition barrier to have the trace stop when it encounters a subnetwork controller, as you can see below.
The shortest path trace cannot be configured to respect terminal paths. However, you can simulate the effects of assigning proper terminal connections by placing a barrier on the feature. In the screenshot below we have simulated designating the manhole as a directional manhole channel.
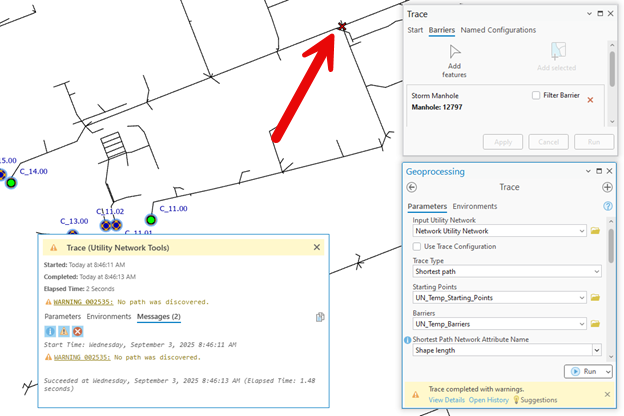
In the above screenshot we can see that this barrier will solve the issue, because the shortest path trace was not able to discover a path between the two locations. To resolve the error with a permanent solution we need to do is configure the manhole to properly manage the distinct sets of flow between the two outfalls/watersheds. Common methods for doing this include the use of a terminal configuration to distinguish upstream pipes from downstream pipes, or in some cases a pipe is only traversed during a low/medium/high wet weather event in which case a network attribute is used to prevent the networks from being connected during a dry weather analysis (the normal state of analysis).
Conclusion
Now that you’ve read this article you should be well equipped to start analyzing and performing quality assurance on Stormwater utility network datasets. If you have any questions about this article, or the utility network in general, you can ask them on the ArcGIS Utility Network channel on the Esri Community site.
Below this article you will find resources related to Stormwater utility networks, including articles related to data modeling, analysis, and data migration.

Commenting is not enabled for this article.