Update: A technical article called Parsing Utility Network Diagnostic Logs has been published on the Esri Community site that contains a more rigorous discussion of how to leverage the diagnostic information described in this article.
Have you ever wondered why some subnetworks update faster than others? Maybe you’re watching the Enable Network Topology tool run, and you’re wondering what is it doing and how much of the network it has built so far? When working with utility network data, developers and administrators often want to know what actions the system is performing at any given time. This is especially true when testing out different configurations and architectures, attempting to isolate specific errors, or trying to understand performance problems. While products like ArcGIS Monitor are great for identifying architectural issues, additional tools are typically needed to identify the underlying cause of something like a performance bottleneck.
The purpose of this article is to show you how several existing tools provided by Esri can help you to better understand system behavior. These tools are generic diagnostic tools that support analyzing a variety of different workflows, however here the focus will be on how to use them specifically to review information related to utility network capabilities. This article does not discuss the format of specific log files or timings, or how to interpret these log files, as that is a very subjective process outside the scope of this article. However, you will learn how to access the log files for the following operations:
Diagnostic Tools
The log files that you use to diagnose the performance issues depends on whether you’re testing in a local geodatabase (File Geodatabase or Mobile Geodatabase) or whether you are using feature services hosted in ArcGIS Enterprise. If you are working with data in a local geodatabase, you must use the Diagnostic Monitor in ArcGIS Pro to see the log messages. If you are working with ArcGIS Enterprise, you must use the ArcGIS Server Logs to see the detailed error messages.
Diagnostic Monitor in ArcGIS Pro
The Diagnostic Monitor in ArcGIS Pro is a diagnostic tool that allows you to monitor activity within your current ArcGIS Pro session in a variety of different ways. The most common tabs you will be using are the HTTP and Log tabs.
The Diagnostic Monitor can be opened in the following ways:
- In an open project, click the Help tab on the ribbon. In the Performance group, click Diagnostic Monitor.
- Press Ctrl+Alt+M while ArcGIS Pro is open. An open project is not needed.
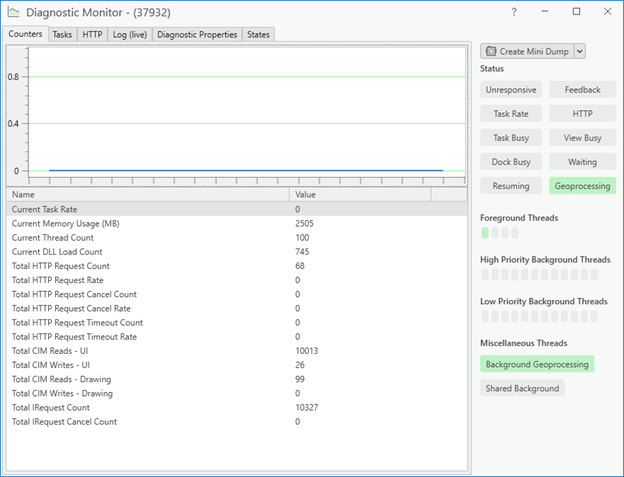
The HTTP tab is useful for monitoring the messages sent between ArcGIS Pro and ArcGIS Enterprise, which is a good way to build a general understanding of how the systems are communicating.
The Log tab gives you diagnostic information generated by the ArcGIS Pro client, regardless of whether you are running against an ArcGIS Enterprise deployment or locally in a single-user deployment against a file or mobile geodatabase. If you are working in a single-user deployment, and set the logging level to debug, you can access additional detailed diagnostic information generated by the utility network like that written to the ArcGIS Server logs in an enterprise environment. From there, you can also access the build, trace, export subnetwork, and update subnetwork logs. These logs are discussed in detail in the second half of this article.
In addition to the utility network specific diagnostic information, these two tabs can also be used to understand generic information about your session, such as the times associated with drawing specific layers, selecting features, or performing edits within your session.
If you find yourself wanting to review the logs from generated from the tool at later date, all are written to your user profile’s document directory at C:\Users\<USERNAME>\Documents\ArcGIS\Diagnostics. This allows you to archive, review, and compare log files from different tests. If you have many log files you want to review, consider using the Extract Logs from Files tool included in the Utility Data Management Support toolbox created by the ArcGIS Solutions team. This tool will extract all the important information from those log files and write them to a local SQLite database for further analysis.
ArcGIS Server Logs
When trying to understand the behavior of ArcGIS Utility Network you are typically working in an ArcGIS Enterprise environment. Much of the actual work of processing requests in ArcGIS Enterprise is handled by specific ArcGIS Server machines, and these servers create log files that contain useful diagnostic information. By default, the log levels for servers are set to log only messages for Warnings or more severe messages. This limited logging is configured for performance reasons; increasing the log level will dramatically increase the amount of log entries being created which can impact the performance and storage requirements of deployment in a production environment.
When you’re working in a development or staging environment it is fairly common practice to increase the logging level on a server for a specific test or scenarios when you know you will be examining the log files. Fortunately, the logging level can be changed for the server without needing to stop/start any services.
The diagnostic messages described in this article will only be visible when the logging level of the server has been set to Verbose or Debug. Doing this will allow you to review the logs to see the timings of specific operations, including the three operations discussed in the logs section below. Log files are the server are organized into separate folders for each service. When looking for log messages you need to keep the following items in mind:
- Each server only captures log messages for the requests it processes. If you have multiple servers, you may need to examine the contents of multiple servers to get all the messages.
- Most operations are logged in the folder specific to that service. However, when an asynchronous operation is be handled by a separate GP Service the logs will appear in that folder. If you’re having problems finding the messages from your test, make sure you check the System/UtilityNetworkTools.GPServer directory.

The server logs are great when you’re working in an enterprise environment, but there are times when you may be testing out a process using a local file or mobile geodatabase. The good news is you can access the same logging information for the utility network, but you must use the Diagnostic Monitor in ArcGIS Pro to access the logs.
Reviewing log files by hand can be tedious and time consuming, especially when you have many log files across multiple machines to examine. To help with this process the ArcGIS Solutions team created the Extract Logs from REST tool as part of the Utility Data Management Support toolbox to help parse and consolidate all log messages to a local SQLite database.
Logs
Now that you understand how to access the different logs containing information about the utility network, let’s look at some specific examples of operations you can analyze and how to find the logs associated with these operations. The information included in each log can vary slightly between each release and may contain slightly different information depending on how the tool was executed (enterprise, asynchronously, etc.) and how your utility network is configured.
What’s most important is that you understand how to find the logs associated with your tests, so that you can begin interpreting your results!
Log Messages
Before we look at specific examples of log messages, it’s worth discussing how log messages appear in each log file. Each operation is designed to write out information incrementally as it runs and usually includes a message at the end that summarizes the entire operation. In the case of ArcGIS Server, you will see the individual messages as they are logged, however, when using the Diagnostic Monitor with single-user deployments you will see only the summary message. An example of a summary message from a trace operation in the Diagnostic Monitor can be found below.
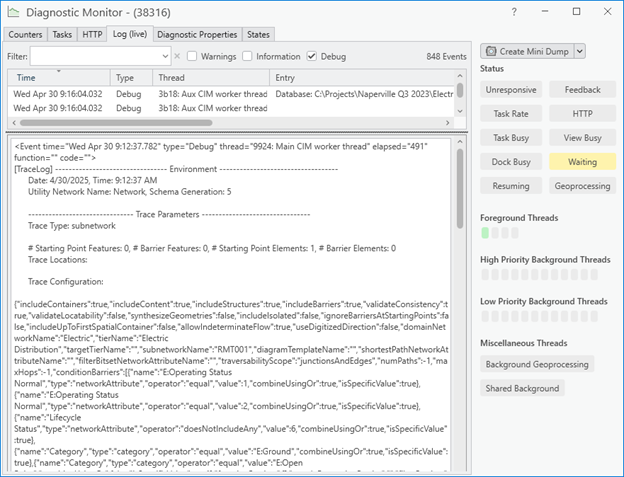
The individual logs will vary, but there is usually a keyword at the top of the log that you can use to identify the operation it represents. There are also usually sections that describe the environment, parameters, steps and timings, and in some cases detailed statistics about the amount of information loaded from the network index. The following list lets you know what keywords to look for in the logs:
- Tracing: TraceLog
- Update Subnetwork: UpdateSubnetworkLog
- Build: See discussion below
- Export Subnetwork: ExportSubnetworkLog
Trace Log
The purpose of the trace log is to understand how long a particular trace took, and why. When interpreting the results, consider how the trace parameters, including the trace configuration, influence how much data needs to be loaded from the network to perform the analysis. Keep in mind that much of the information in the log describes network elements, which are not 1:1 with features. A complex line segment that contains many individual segments is represented using many network elements. A device with terminals is also represented as multiple network elements (one for each terminal and internal edge for the device).
Update Subnetwork Log
This log is generated every time an update subnetwork operation is run. The amount of time an update takes can be evaluated as two separate operations:
- How long did the subnetwork trace take to run.
- How long did it take to update the GIS with the results.
If you want more information about why the trace took so long, this is included as a specific step in the UpdateSubnetworkLog; however, you can search the logs for the TraceLog to get a more detailed breakdown of the time it took to trace the subnetwork that was updated.
The primary factor that affects how long a subnetwork takes to update is how many features need to be updated. The first time that update subnetwork is run for a subnetwork, every feature must be updated, as a result it will take longer than other cases where only a handful of features need to be updated.
Another thing to keep in mind when looking at the update subnetwork log is that your subnetwork definition also plays a role in the update times. Here are some common examples:
- Including structures will cause the trace to take longer because it needs to load all the structures associated with the subnetwork.
- Updating structures will cause the update to take longer because more features may need to be updated.
- Updating a subnetwork with eventing enabled can take longer because as features are updated, edit events are triggered for attribute rules, relationship classes, and feature-linked annotation. Read the Understanding Subnetworks: Events article to understand why.
Measuring the specific impact of each of these configurations is not captured in the logs. However, it could be inferred by creating different datasets with different configurations, repeating a consistent set of tests, and comparing the resulting log files between each test.
If you believe that performance issues may be caused by attribute rules, you can follow the steps in the Troubleshoot attribute rule behavior Knowledge Base article for steps on how to use the same Diagnostic Monitor and ArcGIS Enterprise Server logs to analyze attribute rule performance.
Export Subnetwork Log
This log is generated every time a subnetwork is exported. The amount of time export subnetwork takes can be evaluated as two separate operations:
- How long did the subnetwork trace take to run.
- How long did it take to export the results of the trace to disk.
If you want more information about why the trace took so long, this is included as a specific step in the ExportSubnetworkLog; however, you can search the logs for the TraceLog to get a more detailed breakdown of the time it took to trace the subnetwork that was updated.
The primary factor that affects how long a subnetwork takes to export is how much information needs to be exported. Some of this is a function of the size of the subnetwork being exported, but this is more a function of what information you want to export. Here are a few tips to keep in mind:
- More result types increase the amount of information you need to export. Only include the result types you need to meet your requirements.
- Including fields in the features result type means export subnetwork must query the attribute values from the source table. The tables you include attributes from increase the number of queries that must be made.
- The more fields you include mean that more data must be queried from the database, stored in memory, and written to disk. Limit the fields being exported to only ones that are essential.
- If a field is associated with a network attribute, export the network attribute instead of the field. Network attributes are included in the trace results, and don’t require querying the attribute values from the source table.
- Including geometry in export also requires querying the geometries from each source table. You can individually request geometries from the different result types, so if you are requesting geometries as part of your features there is no need to include it with connectivity.
The common theme for these tips is that you should only choose to export the information that you absolutely need. Choosing to export more information than you need carries a heavy cost, and this is something you can measure in the logs. The time spent retrieving information from the database will occur during the tracing step, while the time spent serializing the results to JSON is measured in subsequent steps.
Build Log
The build log is produced every time a utility network topology is enabled, disabled, or validated. This log is available by default when running an operation against a service when the ArcGIS Server log is in verbose or debug mode.
By default, only the individual steps are reported in the Diagnostic Monitor. This means that you must search for individual step names (Build, ExtractFullExtent, etc.) to see the information associated with that step. To see the full build log and summary when running directly against a file or mobile geodatabase using ArcGIS Pro you must take additional steps.
This decision was made because the full diagnostic log for building the network topology with the verbose setting would not be useful if it was written to the Diagnostic Monitor. You can enable diagnostic logging for the build process in a separate file by adding a value to the windows registry to enable logging of the build process.
To do this you must first create the following registry key, if it doesn’t already exist:
HKEY_CURRENT_USER\Software\ESRI\ArcGISPro\Geodatabase\UtilityNetwork
Then add a DWORD value called LogfileOutputLevel to this registry key. The are:
- 0 = no output
- 1 = simple
- 2 = verbose
Next, you must create the following folder on your computer:
C:\Users\<USERNAME>\AppData\Local\ESRI\ArcGISPro\UtilityNetwork\BuildLog
Once you’ve done that, the next time you run Validate Network Topology, Enable Network Topology, or Disable Network Topology a log file will be generated in this folder.
The resulting log file created in the BuildLog folder contains information about how long each step took, how many features are processed in each step, what the cumulative time spent building the network is, and what the total memory footprint of the build process is at each step.
Other Considerations
From an architecture perspective, you should familiarize yourself with the ArcGIS Architecture Center to understand the best practices for designing and deploying an enterprise system. You should also consider making use of ArcGIS Monitor to help your organization monitor their deployment to help identify bottlenecks or performance issues before they get out of control.
When looking at the time reported by the log files and the time reported by users or by geoprocessing tools it’s important to remember that any given operation contains different levels of communication. The log files you are examining show the amount of time it took to perform the operation from the server perspective, but it may not include the amount of time it took to send the information to a client over the network. Some operations, like tracing, also need to interact with the map after they are run, and this will add additional time not captured in any of the log files. Additionally, when a geoprocessing tool runs, it may need to lock/unlock layers, refresh the map, update GP history in a project or on a dataset, and all these additional steps add time. If there is a significant difference between the times reported by the server and the times user experience, that indicates that the issue may lie outside of the utility network and in your architecture, infrastructure, or even the configuration of your maps.
Looking at performance from a utility network level is great, but sometimes you may want to go even deeper to understand what is happening at a database level. The Diagnostic Monitor includes basic information about the response times of queries to the database, but to go deeper you would need to look at the RDBMS itself. Each RDBMS platform has its own set of unique first and third-party tools to let you analyze performance, and even enumerating those tools is beyond the scope of this article. However, when dealing with enterprise geodatabases it is possible to set up and SDE Intercept to capture and log all the communication from SDE to the database to a log file.
Conclusion
Now that you’ve read this article, you now know how to get more detailed diagnostic information about key operations used for analysis and editing specific to utility network functionality. You can find a more rigorous discussion of how to leverage the diagnostic information described in the Parsing Utility Network Diagnostic Logs technical article on the Esri Community site.
Learning about these tools and techniques is just the first step in understanding system performance. Discussing how to set up and interpret these log files is beyond the scope of this article, however it is a topic that you can find over 15 years of discussions on in the Esri Community site. You can ask general geodatabase questions on the Geodatabase community, while questions specific to utility networks should be asked on the ArcGIS Utility Network community.


Commenting is not enabled for this article.