Customers use the ArcGIS Utility Network to manage, validate, and analyze their utility assets. The most common types of analysis rely on analysis to determine what is upstream or downstream of a given location in the network, or to identify how to isolate portions of the network from their sources/sinks. The ArcGIS Pro 3.7/ArcGIS Enterprise 12.1 release introduced a new feature that allows for traces to include detailed flow direction information for each element returned by the trace. This article will show how this new feature can be leveraged by developers and analysts to provide more robust forms of analysis and visualization using utility network datasets, or to integrate this flow information along with connectivity to external systems.
The new include flow direction option is available on the Trace, Export Subnetwork, and Add Trace Configuration geoprocessing tools. This option allows users to output the flow direction calculated by the trace framework. This is useful for creating tools to help visualize flow direction, perform network analysis, or integrate utility network connectivity with external systems.
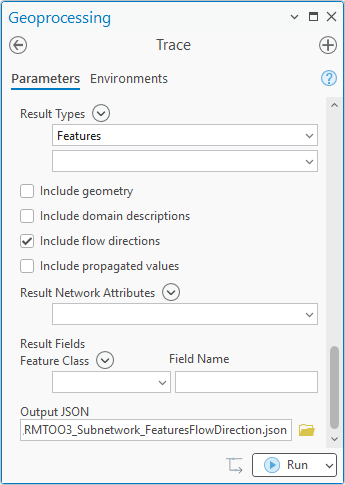
When this option is selected a field called flowDirection will appear in the JSON responses for trace with one of the following values:
- withDigitized – The flow direction on this edge goes from the first vertex to the last vertex.
- againstDigitized – The flow direction on this edge goes from the last vertex to the first vertex.
- Indeterminate – The flow direction on this edge can go in either direction.
Visualizing flow
Calculating flow is the domain of engineers, who model different scenarios of supply and demand to estimate the magnitude and direction of flow in the resources for a given scenario at a moment in time. The network model in the utility network is much simpler than that, so the flow direction it calculates uses subnetwork controllers (sources or sinks), barriers, and directional terminals to estimate the flow direction of resources in the network. This approach has more in common with a mouse wandering a maze looking for cheese than simulating water flowing through a pipe.
The initial release of this functionality extends the Geoprocessing tools and APIs for the utility network to access the flow direction of a trace. At this release, no new tools have been added to ArcGIS Pro to make use of this information. However, a new Show Flow Arrows community sample is available with this release which demonstrates how a developer can create a custom add-in to visualize flow in a subnetwork.
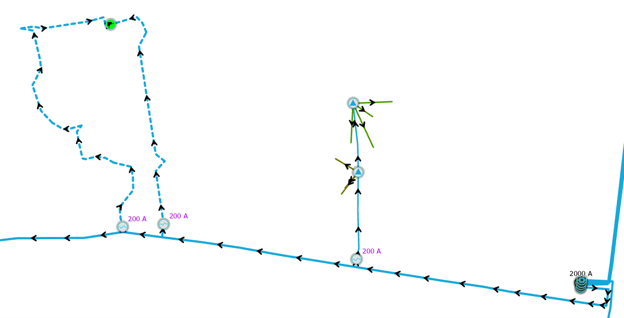
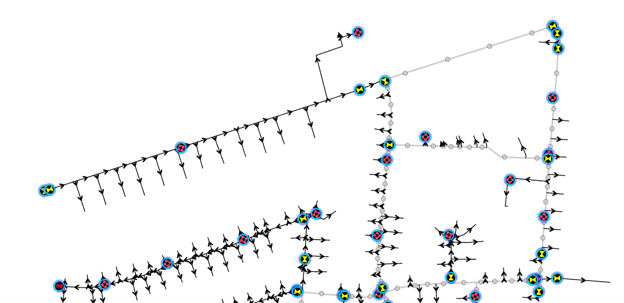
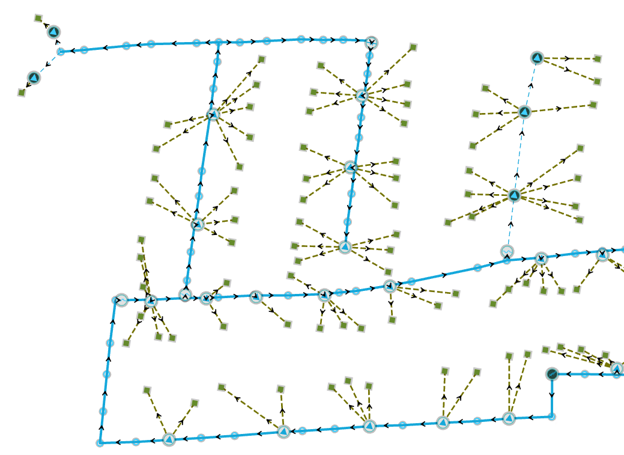
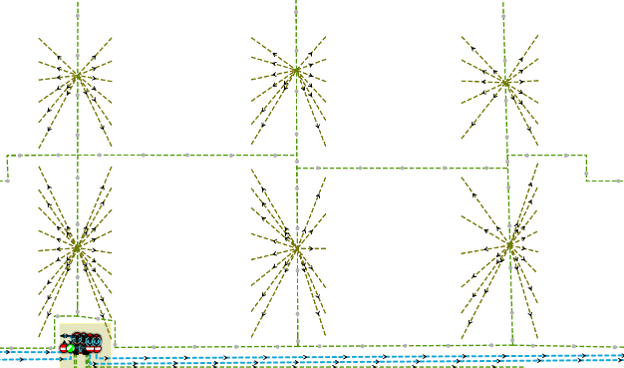
The community sample also lets you import and visualize the flow from a JSON file produced by the Trace or Export Subnetwork tools. This lets you see the flow direction from a particular trace, allowing you to visualize the impacts that placing additional start locations or barriers can have on tracing. This can be useful for performing what-if scenarios like outage response. Below you can see an example of how setting barriers for a trace can turn a looped area in a water network (first graphic) into an area of directional flow useful for hydrant flushing or for planning a district metered area (second graphic).
Indeterminate Flow
As you begin to visualize flow in your network you may notice that some features have indeterminate flow. People often refer to indeterminate flow as areas where the network is looped, but looping is just one of several causes of indeterminate flow we will explore in this article. What is indeterminate flow? Indeterminate flow occurs whenever the direction of flow in the network could be either direction, depending on the supply and demands of the network at a particular moment.
Most electrical networks are designed to have very little indeterminate flow. Electricity is expected to flow one direction through a line at any given moment and changing that direction requires opening/closing switches to reroute power within the network.
The exception to this is mesh networks, where multiple power sources are connected to the same grid to provide a continuous, redundant source of electricity to an area with high reliability.
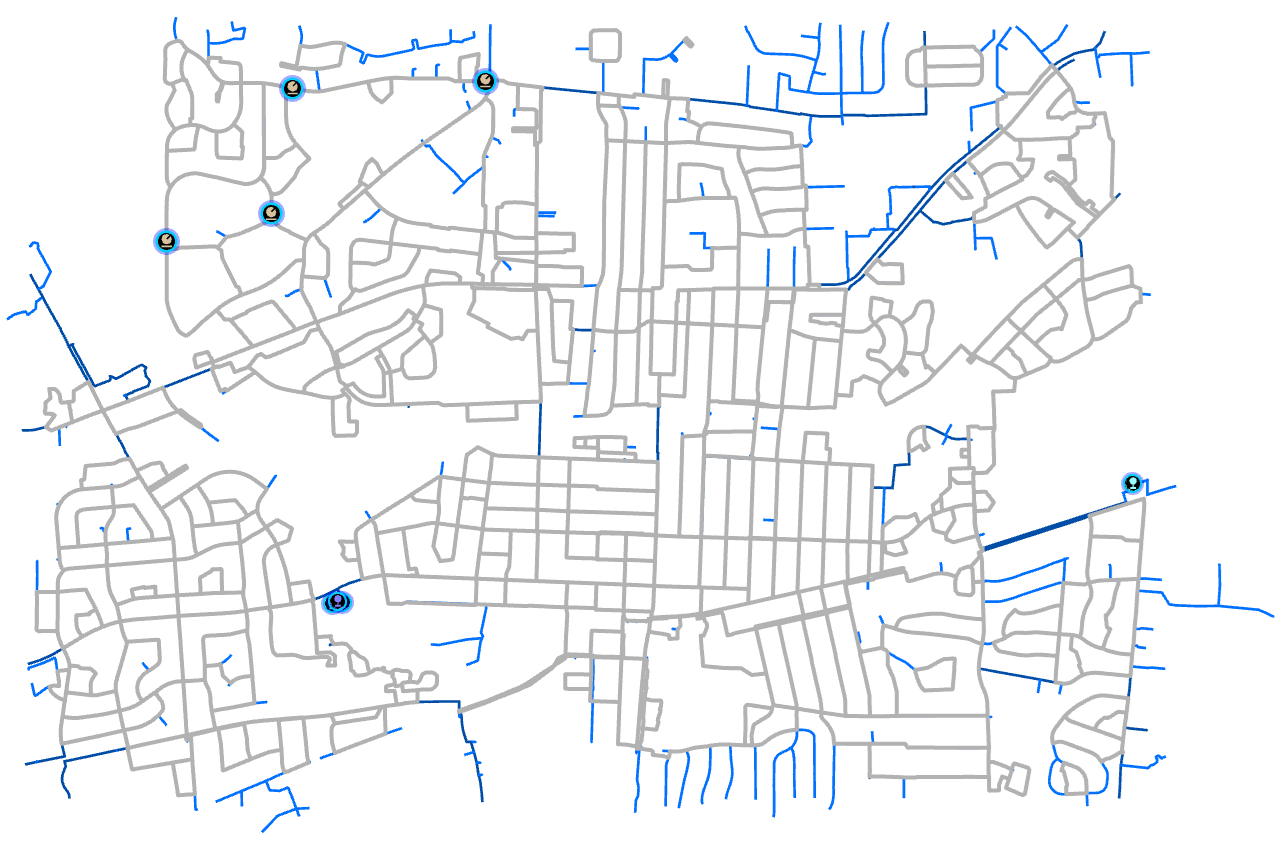
Pressurized networks, like gas and water networks, tend to have more indeterminate flow because they are designed with looping and redundancy. This keeps resources continuously moving which prevents the buildup of materials within pipe. Looking at the same example from above we can see an example of looping in the water distribution system below.
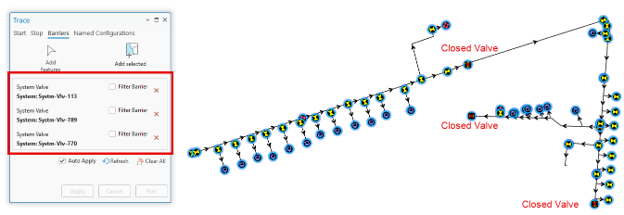
Another common cause of indeterminate flow is when there are multiple sources providing resources to a common area, through the same pipe, but coming from different directions. You can see an example of this below, where three storage tanks are all providing water to a pressure zone, but which tank is active at a given moment would affect which direction the water would flow through the pipes.
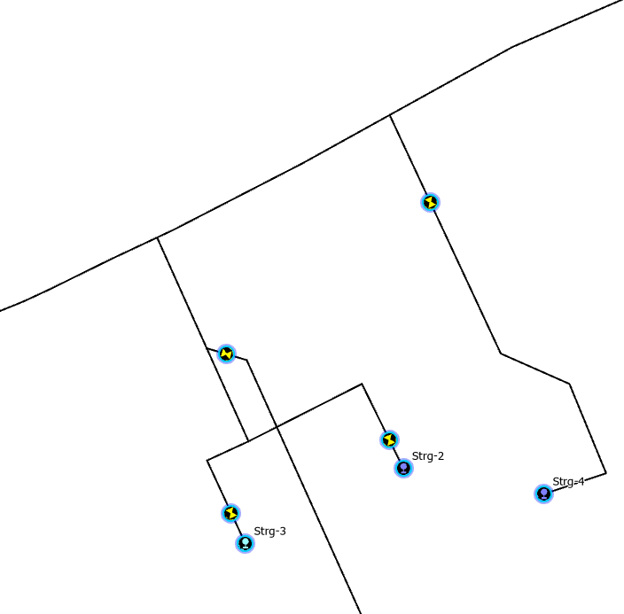
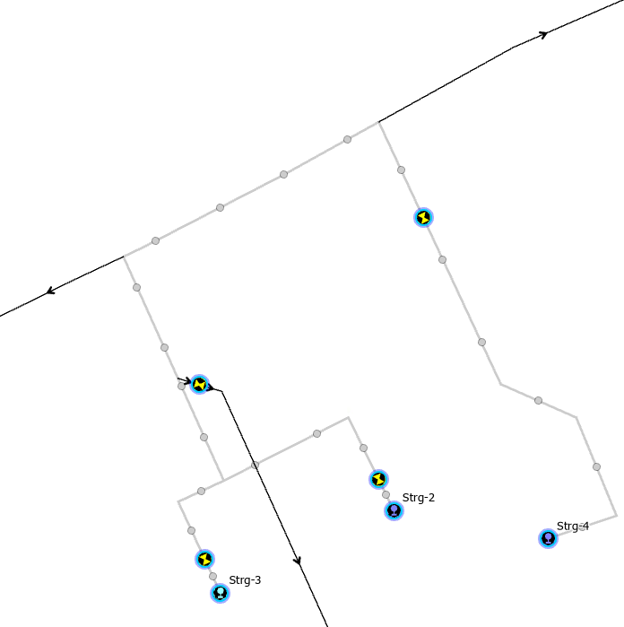
We can verify this by operating valves so that only one tank is active at a time, then reviewing the flow in each pipe. You can see examples of this below.
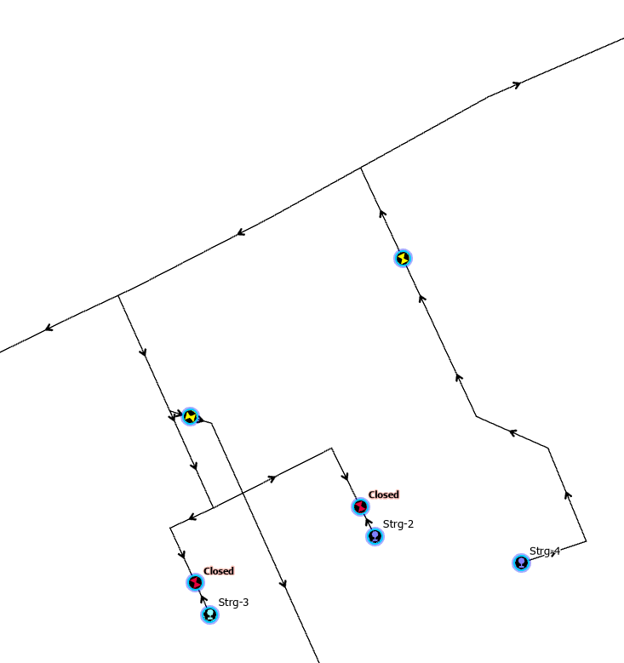
Because GIS models tend to be optimistic in the modeling of water/pressure sources, the valves are left in an open state. This means that when the flow direction is calculated, the area outside the station shows as indeterminate because the water could be flowing either direction through several of the pipes, depending on which storage tank was providing water pressure.
In situations where the GIS is showing flow as indeterminate and you want to know the real-world flow direction you would need to perform calculations using something like a hydraulic model (gas and water) or a load flow model (electric) to determine the flow direction and magnitude of a given line.
Conclusion
The new features that allow trace to return flow directions and propagated values as part trace results are something that can support many important business requirements on projects. These estimated values are no replacement for an actual flow model (hydraulic, electrical, etc) but they do make it easier for an analyst to look at estimated flow direction in situations where they don’t have engineering staff who maintain an engineering model integrated with all the data required to estimate flow using scenario-based engineering models.
You can test out the new functionality using the Show Flow Arrows community sample (requires Visual Studio to compile).
You can watch the ArcGIS Utility Network: Extracting Data presentation from the Esri Dev & Tech Summit that shows how to use this new capability to perform your own analysis.
You can also read this blog to learn about what else is new for the utility network in 2026.


Commenting is not enabled for this article.