Enlighten the next generation
Open a world of possibilities for students by exposing them to this open, authoritative 3D data source.

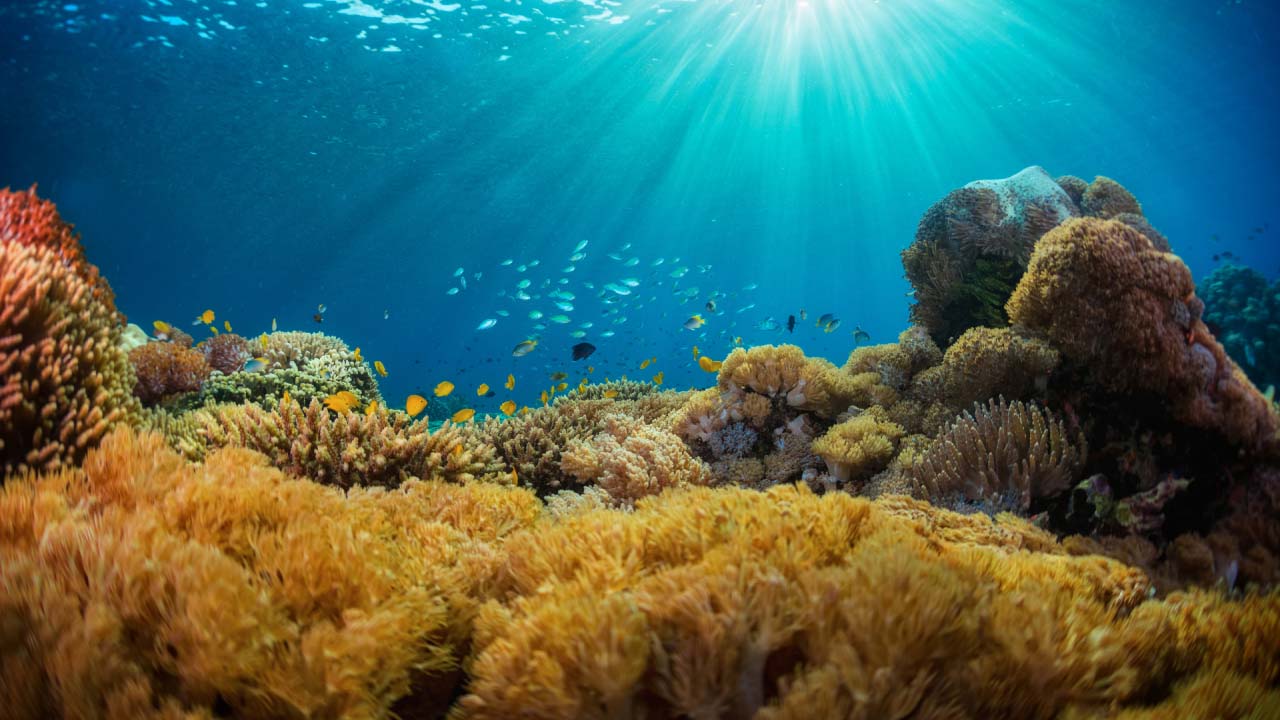
Understanding ocean change
Our oceans are rapidly changing as they absorb the excess human-produced heat and carbon dioxide driving climate change. Detailed, ongoing observations of ocean conditions are necessary to inform adaptation and resilience policies. The newest version of EMU incorporates approximately three million additional ocean observations. Get a globally comprehensive, standardized analysis layer that supports climate change impact studies and marine spatial planning.
EMU are a 3D point mesh framework of 52 million global measurements of six key ocean variables over 102 depth zones clustered into 37 distinct marine physical and chemical volumetric regions. The clustering was repeated, incorporating additional ocean observations. Approximately 3 percent of the points in the 3D mesh changed EMU category. Further research is needed to understand the spatial patterns and potential drivers of the ocean change.
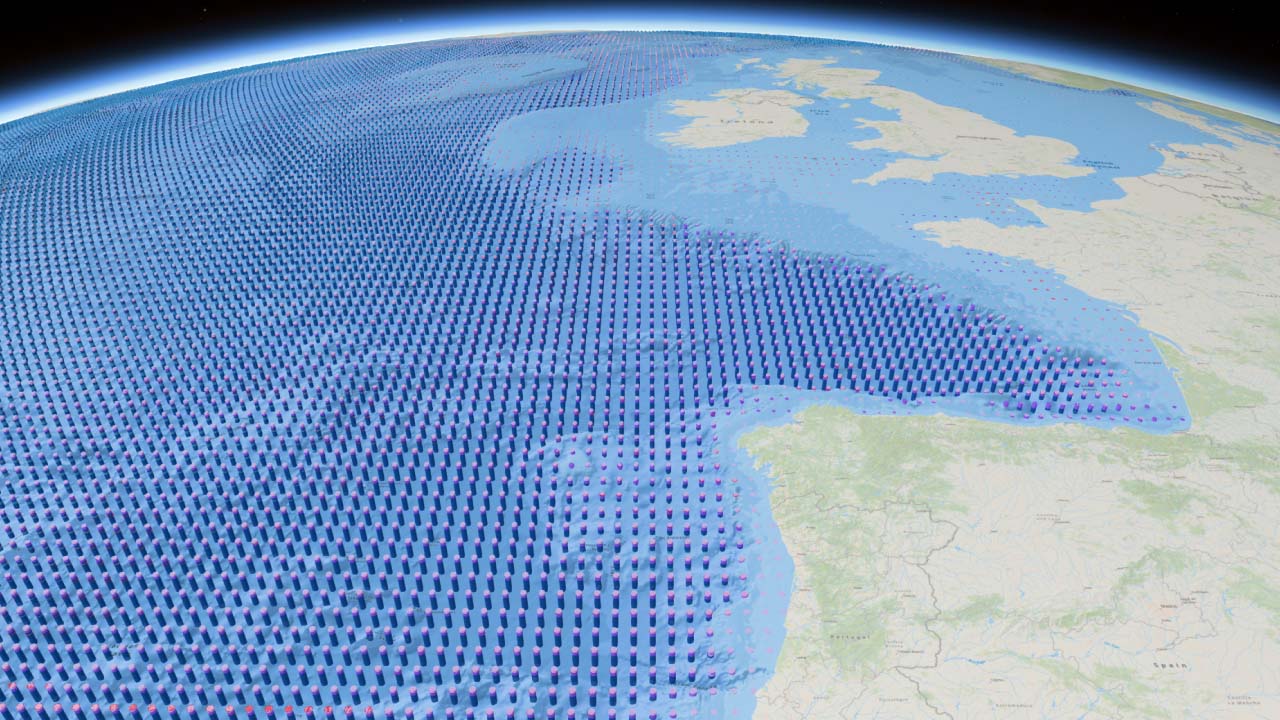
EMU 2018 includes the original six key ocean variables (temperature, salinity, dissolved oxygen, nitrate, phosphate, and silicate) and their updated values at each of the 52 million locations in the 3D point mesh. This data can be used for climate change impact studies, conservation priority setting, economic and social valuation, and marine spatial planning.